
 App Store
 Profile
 Security
 Sign Out
 Feeds
Feeds
 Articles
The Fed’s Liquidity Mirage: Why QT Isn’t Over and QE Isn’t Coming Yet
Bitcoin/ Stock market – What’s Next?
The Big Sunday Report: All You Need to Know
🚩 TA / LCA / Psychological Breakdown: There is a lot of misinformation and confusion circulating about the current macro environment, the Federal Reserve’s actions, and how they affect both the stock and crypto markets. Let’s clear up these misunderstandings step by step in three parts:
1️⃣ QT vs. QE — What’s Actually Happening:
2️⃣ Misunderstanding #2: “The Fed Printed $50bn
3⃣ Misunderstanding #3: “QE IN 6 MONTHS"
1️⃣ QT vs. QE — What’s Actually Happening:
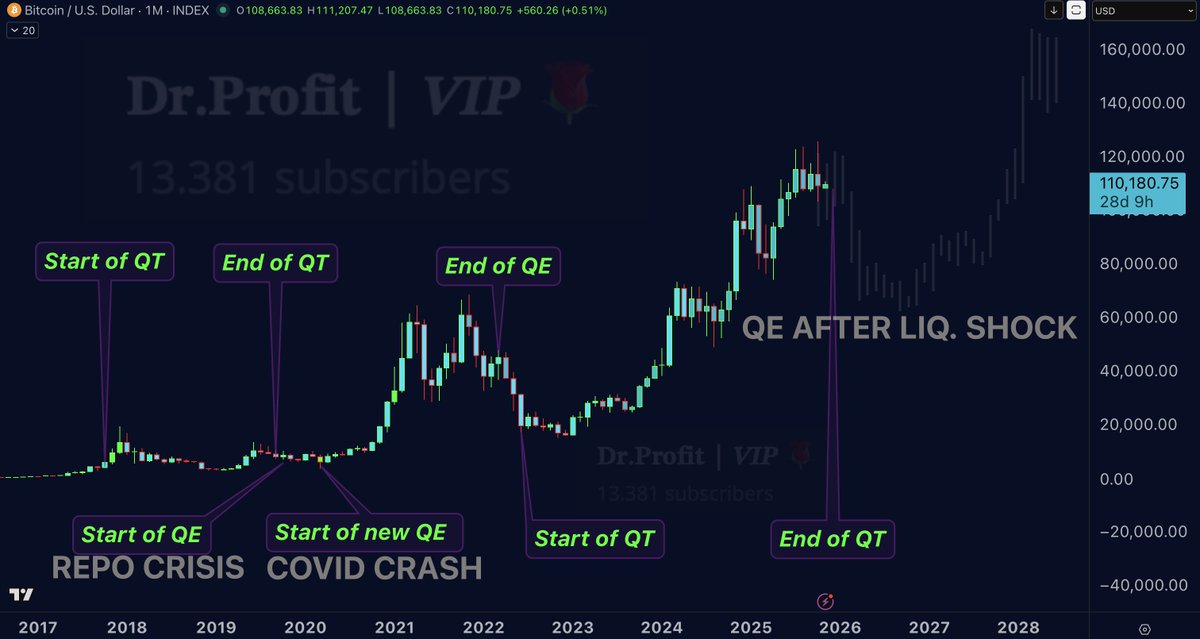
There is a lot of misunderstanding and wrong information circulating about the current market situation. First of all, the end of Quantitative Tightening (QT) is not the start of Quantitative Easing (QE). These are two completely different stages in the monetary cycle. QT means the Federal Reserve is reducing liquidity by letting bonds mature without reinvesting, means in other words, the FED collects back its dollars to pressure down inflation, while QE means the Fed is expanding its balance sheet and injecting new liquidity through asset purchases, which in other words mean money printing. Jerome Powell did not announce QE. He announced that QT will officially end on December 1, 2025. Unlike many analysts that claim that QT ended on the date of the FOMC meeting, its one more big misunderstanding! On the FOMC date, it was announced that QT is going to end on 1st of December, not that it already ended, thats a big difference! Until then, the Fed continues to reduce liquidity in the system. Historically, the Fed only begins QE after a liquidity crisis develops, such as in 2008, the 2019 repo crisis, or the 2020 Covid crash. That pattern has never changed, and there is no evidence that it will be different this time.
2️⃣ Misunderstanding #2: “The Fed Printed $50bn:
One major misunderstanding concerns the idea that the Fed “printed” 50 billion dollars last Friday. This is incorrect. What actually happened was a 50 billion dollar liquidity operation through the Fed’s Standing Repo Facility (SRF). These are overnight loans, not permanent injections of cash. The banks that borrowed this money are required to return it the next day, with a small amount of interest. This means there is no new money created and no permanent increase in the money supply. It is only a short-term liquidity bridge, not quantitative easing or money printing.
To understand this better, it is important to know the difference between the regular repo market and the Fed’s Standing Repo Facility. In the regular repo market, banks and institutions lend to each other overnight using Treasury securities as collateral. The SRF, on the other hand, is a direct backstop provided by the Federal Reserve, introduced in 2021 after the 2019 repo market collapse. The SRF allows banks and primary dealers to borrow cash directly from the Fed, up to a limit of 500 billion dollars per day. This does not mean the Fed prints that amount daily. The funds are lent and then repaid the next day, so the Fed’s balance sheet remains unchanged. If daily borrowing ever comes close to that 500 billion cap, it would signal extreme funding stress, likely appearing first in Japanese or European banks that rely heavily on dollar liquidity.
In normal market conditions, SRF usage is around zero to five billion per day. Seeing fifty billion in a single day is a clear sign of stress. The reason banks used the SRF instead of the regular repo market is because liquidity in the private repo market has dried up. Money market funds that once held around 2.2 trillion dollars in the reverse repo facility have been drained to about 14 billion today. Private lenders are short on cash and are charging higher rates, making borrowing expensive. As a result, banks are being forced to use the Fed’s channel, the SRF, to secure short-term liquidity.
Since August and September I have repeatedly pointed out that a liquidity crisis was forming in the repo market, and we are now seeing the first visible signs of that stress. The surge in SRF usage confirms that the system is tightening. The drained reverse repo pool means there is almost no excess liquidity left. The continuation of QT adds more pressure and makes it harder for banks to fund themselves cheaply. We are entering the late phase of QT, where cracks begin to show, and historically this stage always precedes the next policy shift, usually the start of a new QE cycle.
3⃣ Misunderstanding #3: “QE IN 6 MONTHS":
What most people have absolutely no clue about is that the Federal Reserve conducted QT for the first time in its entire history only in 2017, and it ended in disaster, with the 2019 repo market collapse, followed by the COVID crash. Exactly the same setup we’re witnessing right now. QT ran from October 2017 to September 2019, and just six months later, in March 2020, the Fed was forced to launch a massive QE program after the markets collapsed during Covid. That six-month gap happened only once in history, because 2017 was the first QT in the entire history of the FED. The 2020 QE came six months after QT because it was the first and only time the Fed ever stopped tightening. You can’t take that single data point and pretend it’s some kind of average or pattern. The Fed itself is still experimenting, it has never been here before, and even policymakers are operating blind.
The truth is simple: the system is cracking again, liquidity is drying up, and the real crisis hasn’t even started yet. The REPO is the beginning and we will see much worse days ahead, combined with the current goverment shutdown, so Democrats can blame the Republicans and vice versa.
Regarding #Bitcoin my position remains same, fully in USDT and shorts with an average short entry of 119k. Short orders are placed in the region of 117k to accumulate more shorts if market allows to visit
THIS IS NOT FINANCIAL ADVICE BUT EDUCATIONAL CONTENT ONLY. ALL WRITTEN HERE IS MY OPINION AND MY OWN TRADING AND INVESTING STRATEGY
 Source
 Add to Favorites
 Download image
 Share x
 Copy link
Crypto analyst Murad returns with 116 data-backed reasons arguing the bull run is far from over. From strong ETF accumulation and stablecoin inflows to macro liquidity shifts, he predicts Bitcoin could stay in a multi-year uptrend through 2026.
TechFlow/2 days ago

From BONK to TRUMP, 2024–25 was crypto’s most chaotic wealth engine. Airdrops, AI coins, and celebrity rugs fueled the memecoin supercycle before collapse. What began as freedom and fun ended as a PvP casino—proof that chaos built the culture.
Adam/3 days ago
Coinbase Ventures outlines 2026’s top crypto frontiers: RWA perpetuals, prediction market terminals, unsecured onchain credit, privacy DeFi, and AI-robotics intersections. The next breakout startups will merge finance, AI, and onchain innovation.
Coinbase Ventures/5 days ago
From ICOs to NFTs to memes, every crypto cycle birthed an era where “dumb money” got rich fast. But after nine months of stagnation and no new wealth engine, the casino’s gone quiet. Without a new mania, CT isn’t bearish—it’s just bored.
IcoBeast.eth/2025.11.27
By spotting illiquid Harmonix markets on Polymarket, I exploited rebalancing bots chasing USDC rewards. With just $100, I repeatedly trapped their auto-orders between bid-ask spreads—earning $1,500 in two hours, completely risk-free.
toto/2025.11.25
Strategy Inc. controls 3.26% of all Bitcoin but faces a liquidity cliff. With $54M cash, $700M annual dividends, collapsing equity premiums, and potential MSCI index exclusion, it risks forced BTC sales that could shatter both its model and the market.
Shanaka Anslem Perera /2025.11.25
Hot feeds
A trader profits $448K by monitoring #Binance's new listings!
2024.12.13 17:37:29
A smart #AI coin trader made $17.6M on $GOAT, $ai16z, $Fartcoin,$arc.
2025.01.05 16:05:18
A $PEPE whale that had been dormant for 600 days transferred all 2.1T $PEPE($52M) to a new address.
2024.12.14 10:35:27
Last week, funds have flowed into #Bitcoin, #Ethereum, and #Hyperliquid.
2024.12.16 14:48:36
A sniper earned 2,277 $ETH ($8.3M) trading $SHIRO within 18 hours!
2024.12.03 23:09:08
A whale exchanged WIF and Bonk positions for Fartcoin!
2024.12.25 11:01:14
MoreHot Articles
How did I turn $1,000 into $30,000 with smart money?
2024.12.09
The 30-Year-Old Entrepreneur Behind Virtual, a Multi-Million Dollar AI Agent Society
2025.01.22
10 promising AI Agent cryptos
2024.12.05
10 smart traders specializing in MEMEcoin trading on Solana
2024.12.09
A trader lost $73.9K trading memecoins in just 3 minutes — a lesson for us all!
2024.12.13
What is $SPORE? Let us take you through the on-chain records to show you how it works.
2024.12.25

