
 App Store
 Profile
 Security
 Sign Out
 Feeds
Feeds
 Articles
Bitcoin’s Next Move: Sideways Relief Before a Deeper Bear Market?
Bitcoin – What’s Next?
The Big Sunday Report: All We Need to Know
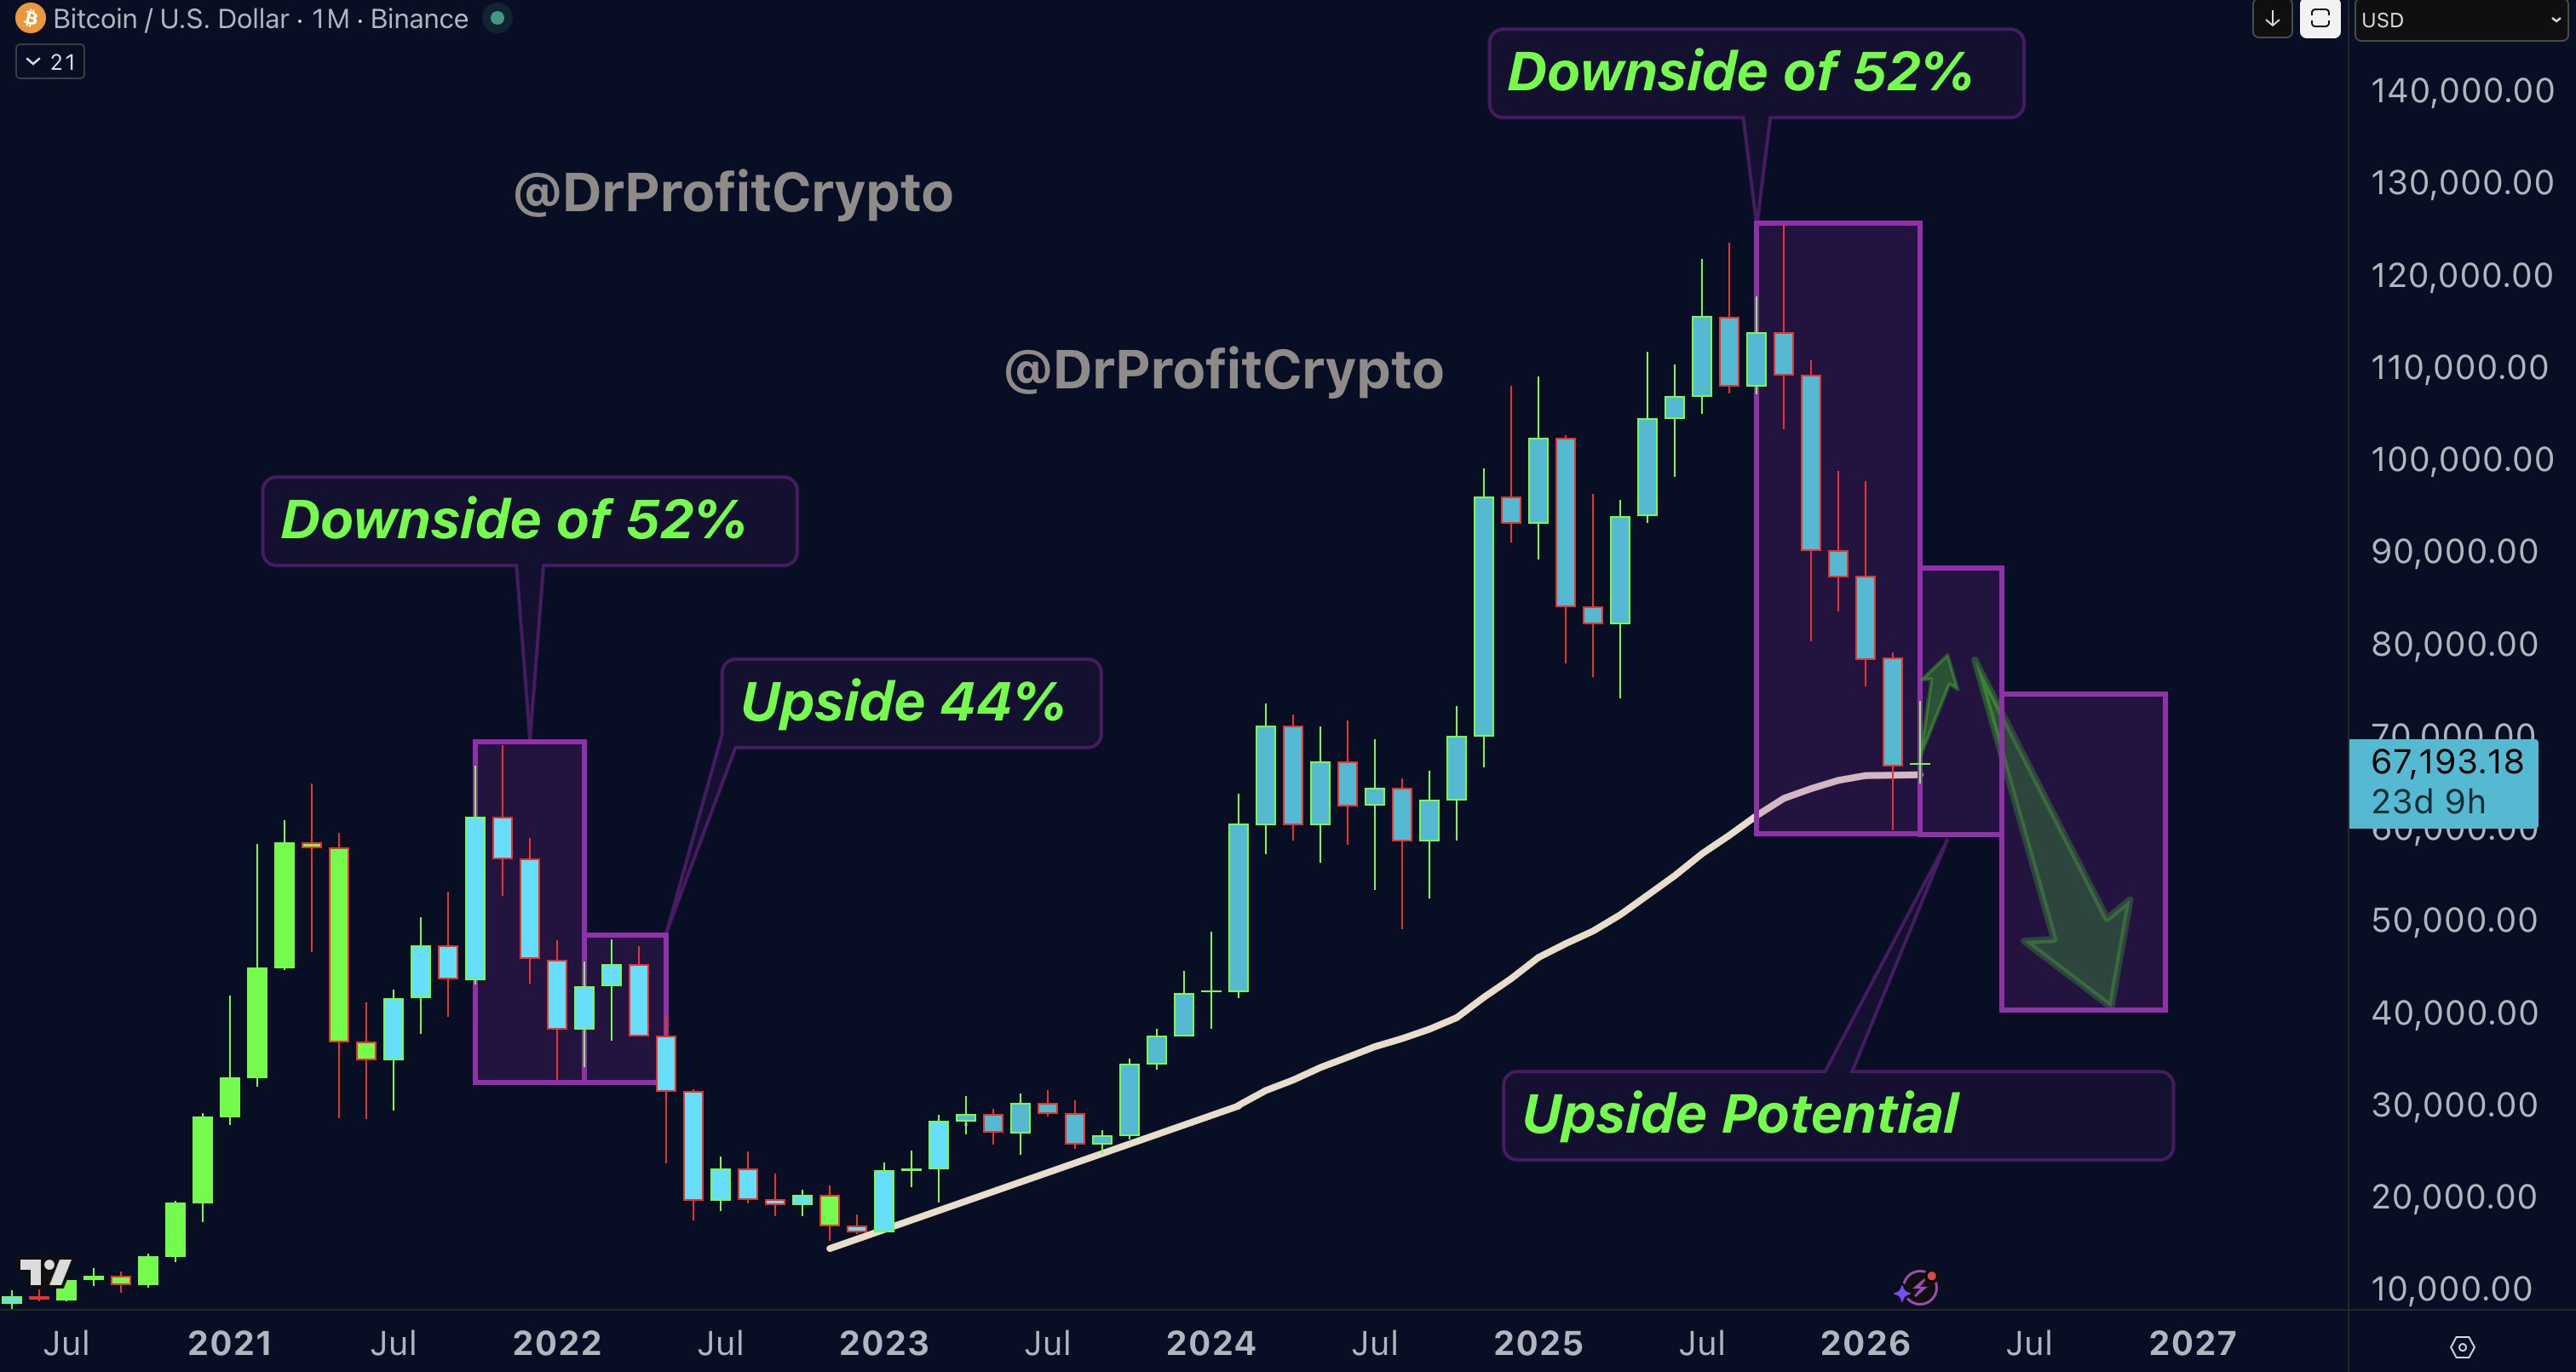
TA / LCA / Psychological Breakdown: In last Month’s Sunday report at 65K, I made it very clear that a new box is forming. I expect Bitcoin to move sideways between 57k and 87k, a 33% range, as already stated. This sideways phase is not bullish, it is the preparation for whats coming in the next months. I expect a leg down after this phase, with a breakdown from the box toward lower targets in the coming months of 44-50k region. One year ago, in 2024, Bitcoin spent an entire year moving inside a box between 58k and 74k. At that time, I repeatedly explained that this box had three main purposes. The most important one was the drawing of future reference lines for the next bear market. I said many times that the 2024 box would play a key role again during the 2026 bear market, in the same price areas. That is exactly what is happening now. Bitcoin is currently trading in a zone where it previously consolidated for an entire year before breaking higher toward 100k. In a bear market context, this same zone is not support, it is structure, and structure eventually breaks. Once the sideways phase is complete, I expect a breakdown below the box.
Bitcoin is entering the phase of relief phase, means sideway move for several weeks with potential bullish moves as shown in the upside potential box. Please compare the charts with 2022, we are repeating the exact move of 2022 in which BTC went down 52% from its ATH, beofre it went up 44% from its low, before the next and strong leg down. Exaclty as what we saw right now! An exact repeat of 2022! Both went down exactly 52% from ATH, and now is the time to start the sideway move. This means Bitcoin that is following the same fractal and has strong upside potential for the coming months before continue going down lower than 60k. The market psycology supports this idea as well as everyone is now scared and the fear and greed is at absolute extreme fear. Before the new leg down happens we need to create additional liquidity in the downside and take the liquidity that was built to the upside. Remember, markets are mainly all about liquidity taking and now is a good time for market makers to send BTC into a relief mode, before the bear market continues.
Current Plan and Range Logic: I am expecting a large sideways movement between 57k and 87k. My clear intention is to buy between 57k and 60k, which is the bottom of the current box. A buy order was hit few weeks ago at 60k and most recently I have bought at 68k. It is critical to understand that the bottom of the box does not mean the final bottom for Bitcoin. It means the bottom of the current phase. I buy 57k–60k for percentage gains, not for the long term plan as I usually do.
As an example, Bitcoin is already up roughly 12% up from the 60k buy entry I shared a few weeks ago, and 2% down from the recent 68k buy order. Does this mean 88k is a guaranteed target? No. It means two simple things. First, Bitcoin between 57k and 60k is in a recovery and bounce phase, which usually includes sideways action. Second, the highest level I expect Bitcoin could reach during this phase is around 88k, depending on the strength and duration of the sideways market. If the market allows a visit to the 88k area, I am open to adding more to my existing shorts that were opened between 115k and 125k and are still fully held.
Positioning and Execution: Some people like to complicate things. From my perspective, it is very simple. I am holding shorts from 115k–125k. At the same time, I placed multiple spot buy orders between 57k and 60k, in addition to the recent 68k buy order. I plan to hold these gains because I expect continued sideways action and no immediate further downside in the coming weeks. I consider 57k–60k the local bottom, not the macro bottom, and I expect this area to be tested multiple times. That is exactly why buying there makes sense to me. There is no reason to sell while upside potential remains. When the moment to sell comes, I will metion once I sold or planning to sell.
Bitcoin will move sideways until it no longer does. The largest and most aggressive long-term bets will be placed much lower, between the 50k level and into the low 40s. That is where I will re-enter with serious size for the next cycle, while taking profits from the 115k–125k short, and thats the area I believe Bitcoin will be finally bottomed out. This area is expected to be hit in September-October as my calculations show, in the meantime? A long and boring sideway as mentioned exactly one month ago.
Why I am Buying Now in a Bear Market? Some ask why I am buying now if I expect Bitcoin to eventually bottom below 50k. The answer is simple: markets do not move in straight lines. Even in bear markets, there are powerful counter-trend rallies. In 2022, Bitcoin dropped from 68k to 33k almost without pause. Then, within two months, it rallied from 33k to 48.5k, a 50% move, before contin
uing down to the final bottom at 16k. This is how markets work. We are in a bear market. The bounces are temporary and exist to build liquidity for further downside. My ultimate bear market target remains below 50k, in the 40s area. That is where my largest positions will be built. Until then, my short from 115k–125k remains fully open. I am not longing with leverage. I am buying spot between 57k and 60k while keeping the short open.
THIS IS NO FINANCIAL ADVICE AND EDUCATIONAL CONTENT ONLY
 Source
 Add to Favorites
 Download image
 Share x
 Copy link
Davinci Jeremie urged people to buy $1 of Bitcoin in 2013 and became a symbol of early conviction. Years later, fame, lifestyle flexing, and token promotions sparked criticism. His journey reflects both crypto foresight and influencer-era controversy.
StarPlatinum/2026.03.04

A sweeping narrative ties Jane Street to India’s expiry-day options case, alleged 10AM Bitcoin sell patterns, Terra’s collapse, and ETF plumbing. While none prove misconduct, critics argue a common structure: move spot, monetize derivatives, keep execution opaque.
Bull Theory/2026.02.27
A controversial narrative links Jane Street, ETF mechanics, and Bitcoin’s price behavior, pointing to lawsuit allegations, 10AM volatility patterns, and derivative hedging dynamics. The discussion raises broader questions about liquidity, structure, and price discovery.
Justin Bechler/2026.02.26
A new federal lawsuit alleges Jane Street exploited non-public information tied to Terraform’s liquidity defenses, accelerating UST’s depeg and the Terra collapse. The firm denies the claims. The case may reignite debates on structure, design, and regulation.
Diana/2026.02.25
Mean reversion and on-chain models sit at levels historically linked to bottom formation after capitulation. Realized losses reached record USD values, while deviations from anchor models remain extreme. Price pain may be fading; patience remains key.
Checkmate/2026.02.25
Bitcoin didn’t fail as an asset — it matured into an ETF-driven trade. As institutional ownership rose, correlation with tech risk intensified. Short-term pressure reflects holder structure shifts, not thesis collapse.
Eric Jackson/2026.02.24
Hot feeds
A trader profits $448K by monitoring #Binance's new listings!
2024.12.13 17:37:29
Last week, funds have flowed into #Bitcoin, #Ethereum, and #Hyperliquid.
2024.12.16 14:48:36
A $PEPE whale that had been dormant for 600 days transferred all 2.1T $PEPE($52M) to a new address.
2024.12.14 10:35:27
When Elon Musk tweeted about Moltbook, the meme coin MOLT experienced a short-term 30% price surge, hitting a new all-time high of $114 million.
2026.01.31 18:37:29
A smart #AI coin trader made $17.6M on $GOAT, $ai16z, $Fartcoin,$arc.
2025.01.05 16:05:18
A sniper earned 2,277 $ETH ($8.3M) trading $SHIRO within 18 hours!
2024.12.03 23:09:08
MoreHot Articles
How did I turn $1,000 into $30,000 with smart money?
2024.12.09
10 promising AI Agent cryptos
2024.12.05
The 30-Year-Old Entrepreneur Behind Virtual, a Multi-Million Dollar AI Agent Society
2025.01.22
10 smart traders specializing in MEMEcoin trading on Solana
2024.12.09
A trader lost $73.9K trading memecoins in just 3 minutes — a lesson for us all!
2024.12.13
What is $SPORE? Let us take you through the on-chain records to show you how it works.
2024.12.25

