
 App Store
 Profile
 Security
 Sign Out
 Feeds
Feeds
 Articles
Who Really Paid for This Bull Market? Bitcoin’s Shift from Crypto Cycles to Wall Street Plumbing
Who Pays for the Bull Market

“The Open Hand from the West” has been almost six years ago now. After two full cycles, crypto has finally delivered on much of the “wishlist” people talked about over the past decade. The things described in that essay are happening rapidly: institutions allocating to Bitcoin, full integration with TradFi products, Circle going public with fanfare, and even the U.S. president openly endorsing the space and posting memes himself. Under the old script, this should have been the textbook opening of a high-beta bull market.
Yet what we actually saw was volatility collapse. Market-moving catalysts were front-run. An industry that should have been full of “surprises” became oddly dull as assets were fully financialized and mainstreamed.
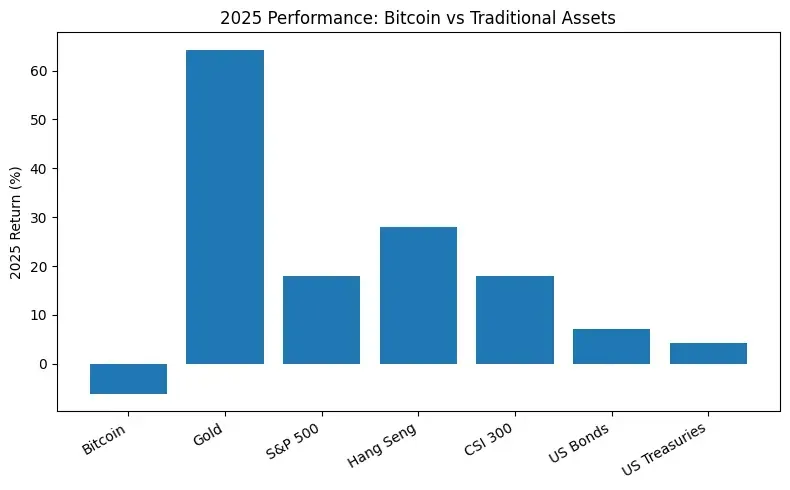
Across asset classes, even with supportive policy and institutional tailwinds, BTC clearly underperformed major TradFi assets in 2025—gold, U.S. equities, Hong Kong stocks, A-shares—making it one of the few assets that failed to set synchronized new highs with global risk assets.
Starting in early 2024, I discussed multiple times on my English X account @DoveyWan the structural changes in the liquidity supply chain caused by asset mainstreaming. A few representative examples:
CME BTC open interest surpassed Binance as early as 2024
ETF launches provided ideal conditions for Wall Street arbitrageurs, sharply compressing volatility
The triparty banking agreements pushed by Binance and OKX struggled to gain traction
CME ETF options and future spot listings will further squeeze offshore exchanges
In 2025, CBOE and CME began accepting crypto as in-kind collateral, significantly improving collateral mobility
DTCC will directly connect to several public blockchains this year, opening on-chain rails for equities at the source
As crypto’s participant structure and liquidity supply chain undergo real transformation, the key questions become: who is buying, who is selling, and who is quietly leaving?
The Onshore–Offshore Divide
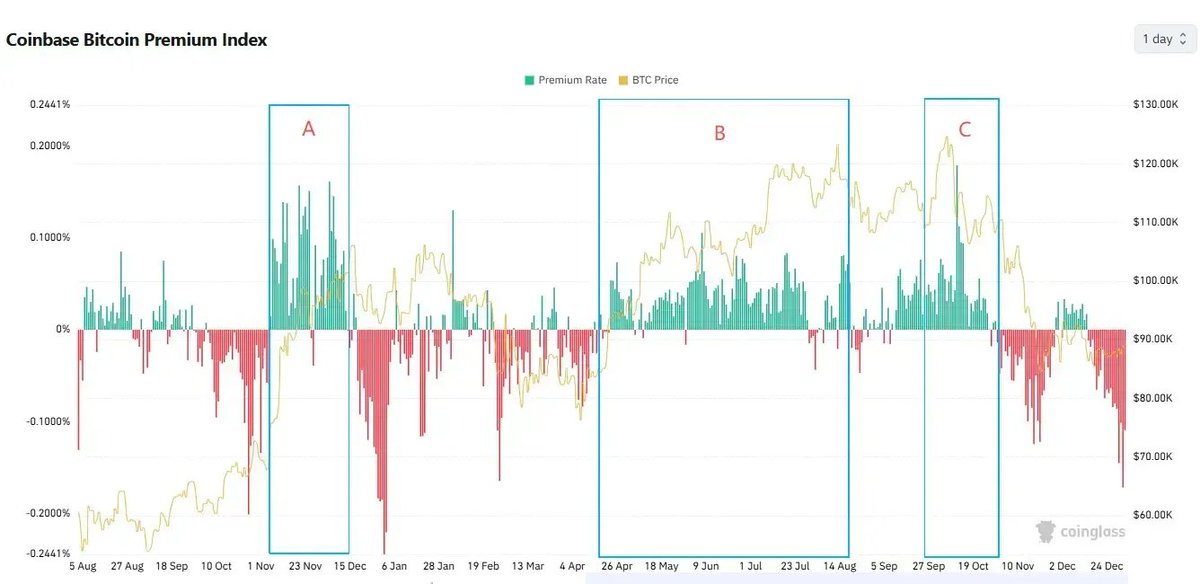
To understand this cycle’s capital structure, we need to break down BTC’s three major highs:
Phase A (Nov 2024 – Jan 2025): Trump’s election and improved regulatory expectations triggered full-market FOMO onshore and offshore. BTC broke $100k for the first time.
Phase B (Apr 2025 – mid-Aug 2025): After deleveraging, BTC rallied again and first broke $120k.
Phase C (early Oct 2025): BTC recorded its local ATH of the cycle, followed shortly by the Oct-10 flash crash and a correction phase.
Across spot and derivatives, all three phases shared several features:
Spot
Onshore buyers dominated, while offshore players tended to reduce exposure into strength. Coinbase Premium stayed positive during all three tops, indicating that high-price buying mainly came from onshore spot flows led by Coinbase.
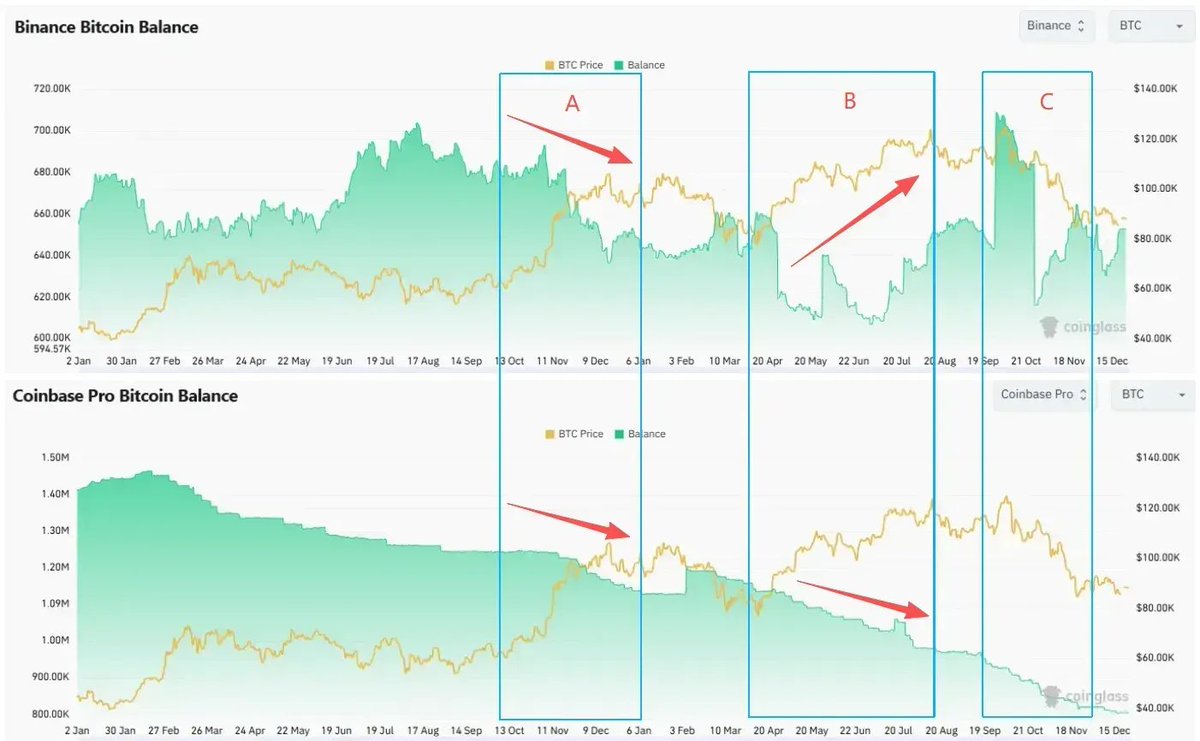
Coinbase BTC balances trended down throughout the cycle, reducing sellable CEX supply. In contrast, Binance balances rose noticeably during Phases B and C as prices rebounded, signaling increasing offshore spot selling pressure.
Futures
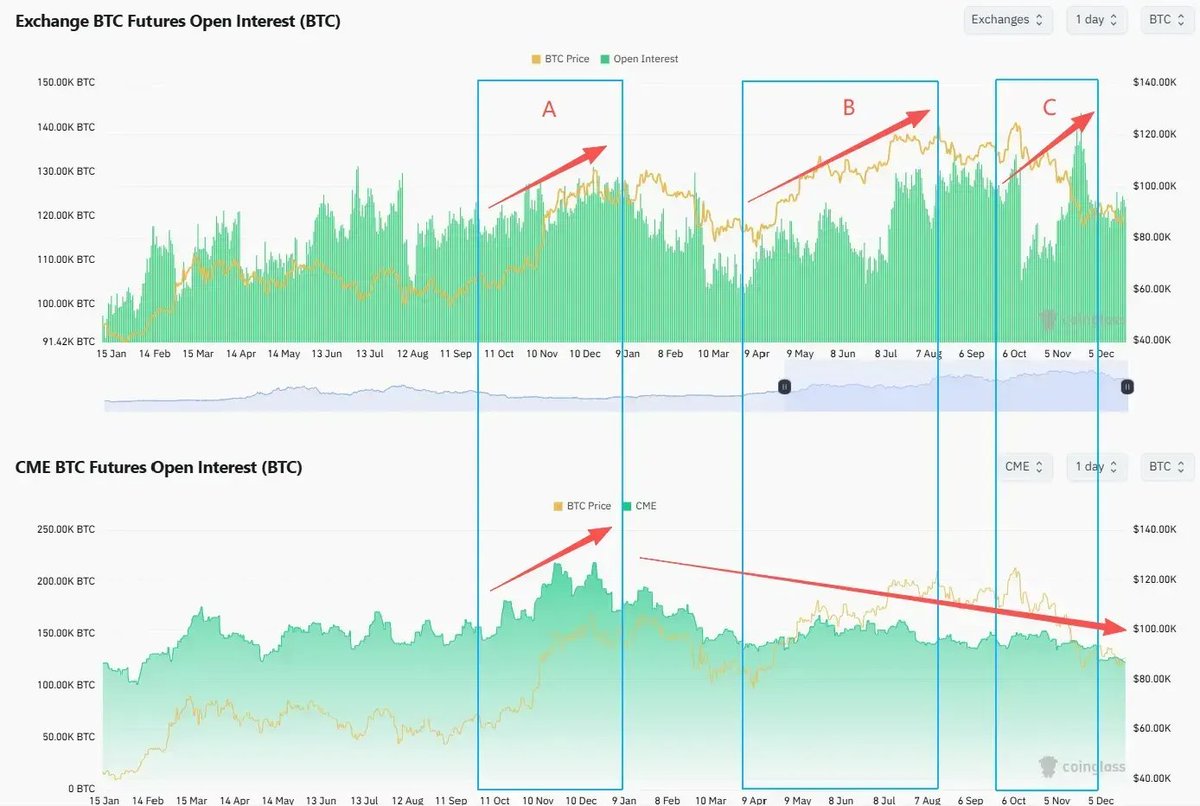
Offshore leverage stayed active, while onshore institutions steadily reduced positions.
Offshore BTC-denominated open interest (e.g., Binance BTC OI) rose continuously in Phases B and C, reflecting rising leverage. Even after the Oct-10 deleveraging event, OI quickly rebounded and even set new highs. Meanwhile, CME-led onshore futures OI declined steadily from early 2025 onward and did not recover during price highs.
At the same time, BTC volatility diverged from price. When BTC first broke $120k in August 2025, Deribit DVOL sat near cycle lows, with implied volatility failing to price continuation risk—showing option markets growing cautious about trend persistence.
Spot reflects long-term asset allocation decisions. Divergent behavior between onshore and offshore reveals differing convictions about BTC’s long-term value. CME and options players are the smartest money, hypersensitive to risk. Their trading setups and time horizons made the difference obvious.
“Dumb Money” Institutions?
In early 2025, two key policy changes enabled structural onshore buying:
Repeal of SAB 121: Banks no longer needed to record custodial BTC as liabilities, making BTC custody viable for banks like BNY Mellon and JPMorgan.
FASB fair-value accounting (effective Jan 2025): Corporations could mark BTC at fair value instead of impairment-only accounting, turning BTC from a volatile intangible asset into a balance-sheet reserve option.
These changes laid the accounting and compliance groundwork for DATs, corporate treasuries, and some institutional allocations. From Q1 2025 onward, we received many DAT fundraising pitches. The core competency of DAT sponsors is simple: fundraising. Institutions aren’t smarter than retail—they just have cheaper capital and more financial tools.
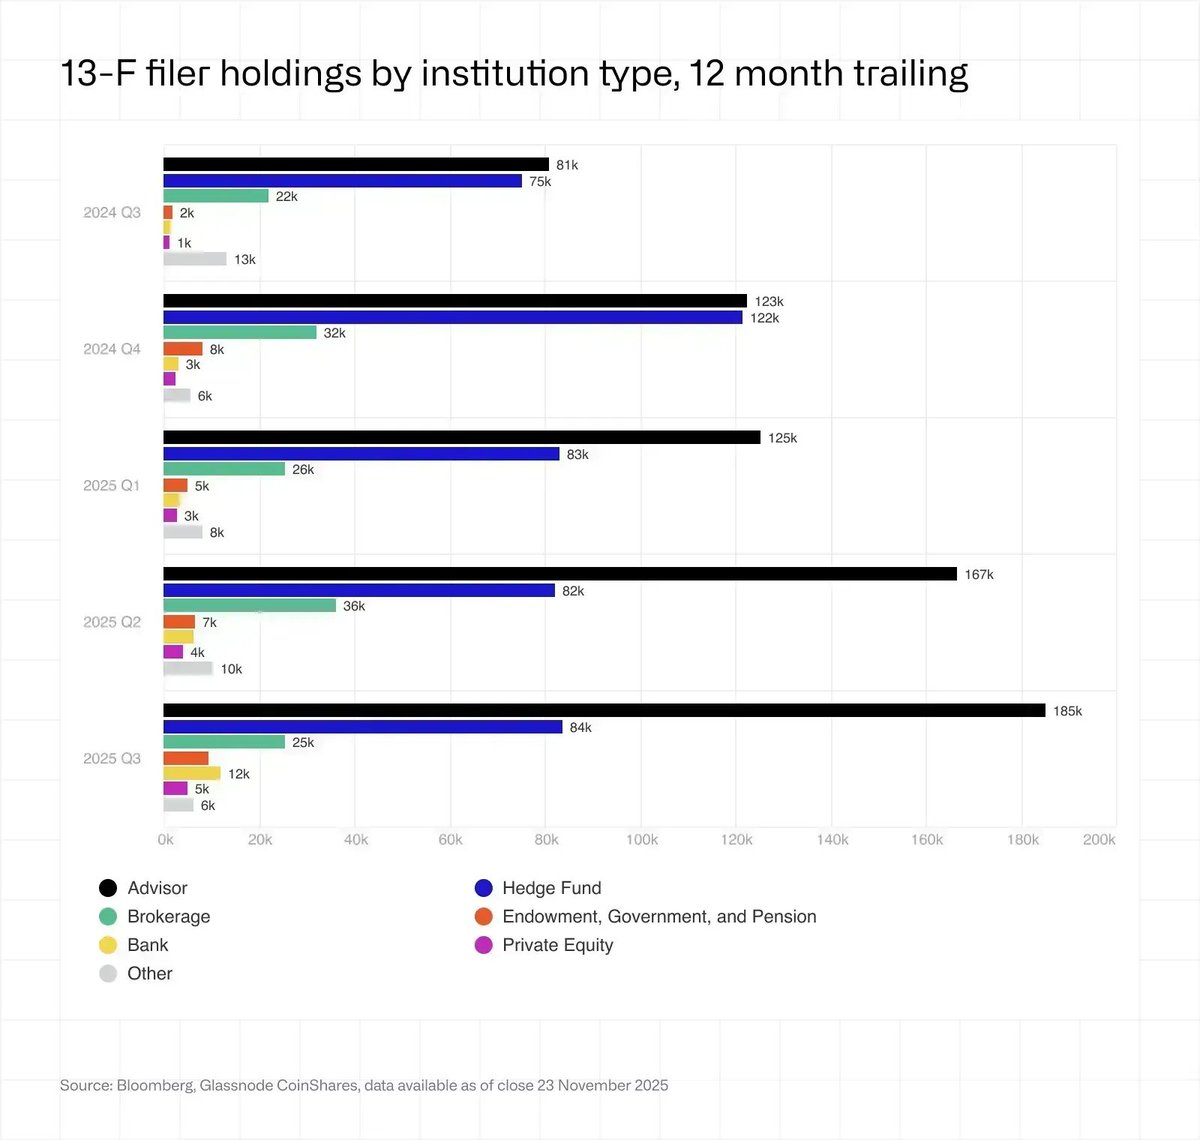
Glassnode data shows BTC held by DAT companies rose from ~197k BTC in early 2023 to ~1.08m BTC by end-2025, a net increase of ~890k BTC. DA
Ts became one of the most important structural buyers this cycle.
Their model is NAV-premium arbitrage:
When shares trade above crypto NAV, companies issue equity or convertibles at inflated valuations
Proceeds are used to buy BTC, raising BTC per share and reinforcing the premium
Rising prices make fundraising easier, incentivizing buying into strength
MicroStrategy exemplifies this: its largest BTC purchases and convertible issuance in 2024–2025 coincided with BTC near ATHs. In Nov–Dec 2024, as BTC approached $100k, MSTR issued $3B of 0% convertibles—the largest ever—and bought over 120k BTC at average prices above $90k.
High-price accumulation wasn’t chasing—it was balance-sheet mechanics.
ETF flows are also misunderstood. ETF AUM is still mostly non-institutional; traditional institutions hold less than a quarter. Within institutions, advisors allocate passively and steadily, while hedge funds are price-sensitive and focused on arbitrage. Hedge funds reduced exposure after Q4 2024, matching CME OI declines.
Institutions aren’t diamond hands. Most make money from fees or carry. Even top-tier crypto VCs from the 2016 vintage achieved DPI of only ~2.4x by 2024—far below BTC’s 10-year performance.
Retail’s edge is flexibility. Institutions die from path dependence. Exchanges die from misuse of customer funds and security failures.
Missing Retail
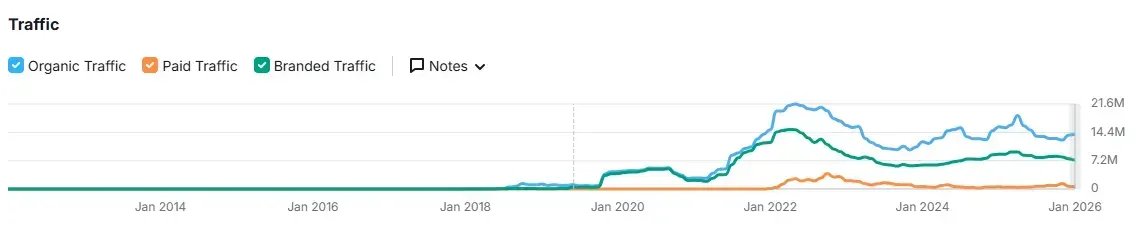
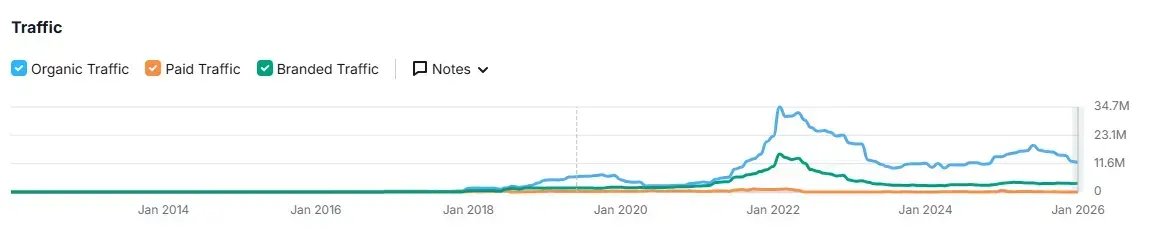
Traffic data from major CEXs like Binance and Coinbase shows steady decline since the 2021 peak—even as BTC hit new highs. The contrast with Robinhood’s surge is striking.
In 2025, the “wealth effect” concentrated outside crypto: S&P 500 (+18%), Nasdaq (+22%), Nikkei (+27%), Hang Seng (+30%), KOSPI (+75%), A-shares (~+20%), gold (+70%), silver (+144%). AI equities offered stronger narratives, 0DTE options delivered casino-level excitement, and retail speculated on macro events via Polymarket and Kalshi.
Even Korean retail—once synonymous with high-frequency crypto speculation—retreated from Upbit to pile into KOSPI and U.S. equities. Upbit’s average daily volume fell ~80% YoY in 2025, while KOSPI surged over 70%. Korean net buying of U.S. stocks hit a record $31B.
Emerging Sellers
In August 2025, BTC decoupled from tech stocks after peaking alongside ARKK and NVDA, then crashed on Oct-10 and never recovered. Coincidentally, Galaxy disclosed facilitating the sale of over 80k BTC for an early holder within 7–9 days in late July.
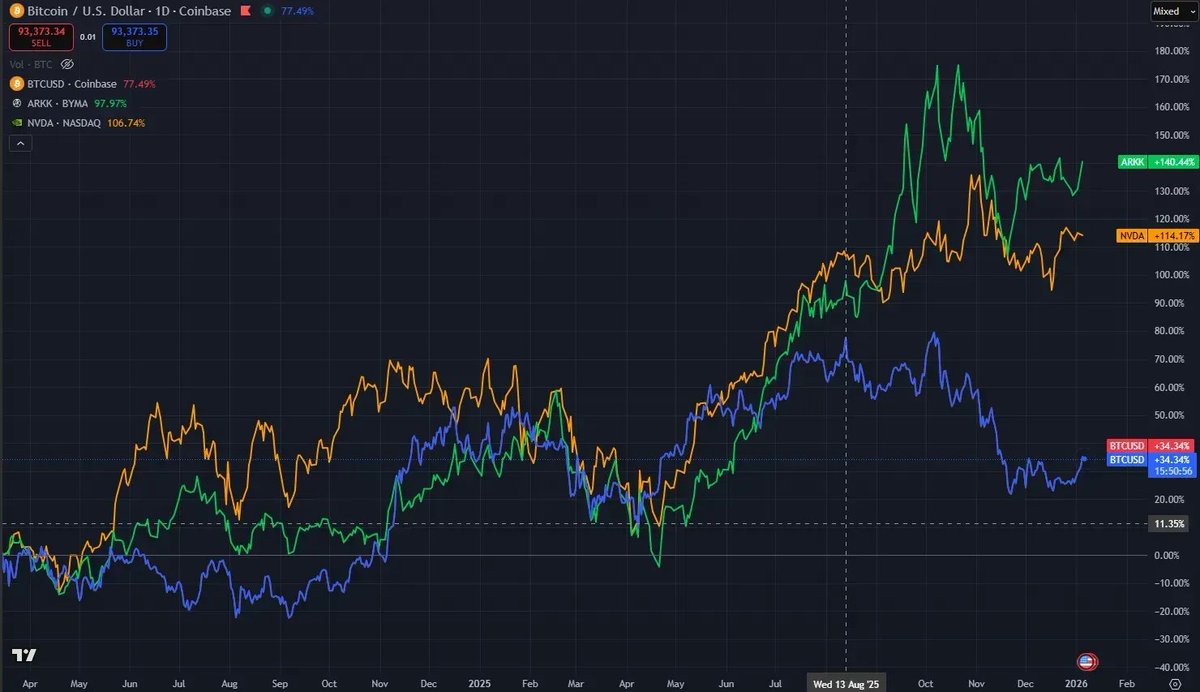
As BTC wrapper products mature, OG whales now exit via structured products and asset rotation into TradFi. Galaxy’s biggest growth in 2025 came from helping whales rotate BTC into IBIT. Paper BTC offers far superior collateral mobility and capital efficiency than native BTC—mirroring the financialization path of precious metals.
Miners: From Paying Power Bills to Funding AI CAPEX
From the 2024 halving through end-2025, miner reserves experienced their steepest and longest decline since 2021. By end-2025, miner reserves stood at ~1.806m BTC, with hash rate down ~15%.
Selling is no longer just to cover electricity:
~$5.6B BTC sold to fund AI data-center CAPEX
Bitfarms, Hut 8, Cipher, Iren converting mines to AI/HPC centers with 10–15 year contracts
Riot shifted from HODL to selling monthly production in April 2025
By 2027, ~20% of miner power capacity is expected to be redirected to AI.
Financialized Paper Bitcoin
Bitcoin is transitioning from crypto-native price discovery to passive allocation via ETFs, DATs, and sovereign balance sheets—largely as paper BTC. BTC becomes a portfolio component, purchased by weight. Mainstreaming is complete, but leverage cycles and systemic fragility follow.
Incremental demand now comes from passive and balance-sheet buyers, while crypto-native capital increasingly sells into strength.
BTC’s correlation with U.S. equities—especially high-beta tech—has risen, amplifying macro liquidity effects. Financial proxies increase efficiency but expose crypto to DAT unwinds, collateral haircuts, and cross-market credit stress.
Where the Road Leads
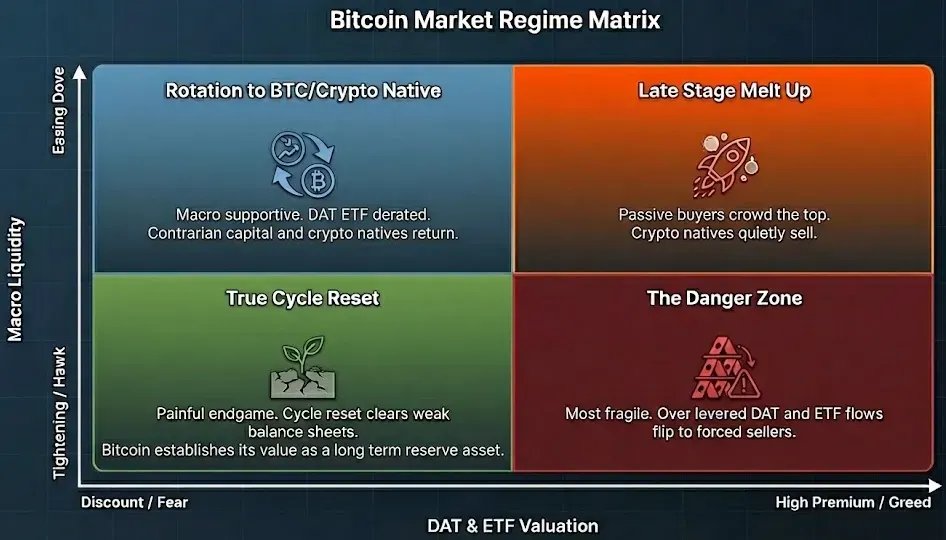
The old “four-year halving cycle” no longer explains BTC price action. The next phase is driven by two axes:
Vertical: macro liquidity and credit (rates, fiscal policy, AI cycle)
Horizontal: DAT/ETF premiums and valuations
Four regimes emerge:
Easy liquidity + high premiums: high-FOMO environments like late 2024–early 2025
Easy liquidity + discounts: favorable macro, opportunity for crypto-native rebuilding
Tight liquidity + high premiums: highest risk of violent unwinds
Tight liquidity + discounts: true cycle reset
In 2026, we likely move toward “easy + discount” or “slightly easy + discount.” Key variables include:
SFT Clearing and DTCC 24/7 tokenization, embedding BTC deeper into Wall Street collateral systems
AI trade entering expectation-burn phase—earnings strong but price response muted
Further BTC–alt decoupling as BTC flows remain institutional while alts rely on higher-risk capital
Price matters. Crossing $100k elevated BTC into a national-level strategic asset. But crypto’s journey is far from over. As I wrote in 2018 when founding Primitive Ventures:
“Distributed consensus among individuals and the dissipative nature of information give crypto assets extraordinary vitality. From the pursuit of freedom, equality, and certainty in assets and data comes the possibility that entropy always rises, yet crypto lives on forever.”
When capital markets intertwine with cultural movements, they generate economic forces stronger than culture alone. Crypto—populist finance—is the purest expression of this intersection.
If crypto rails become the sole supranational liquidity infrastructure, generating real cash flows and applications that bring ETF and DAT gains back on-chain—turning passive allocation into active use—then today marks not the end of a cycle, but the beginning of true adoption.
From Code is Law to Code is Eating the Bank. We’ve already endured the hardest 15 years.
Every revolution begins with the decline of old beliefs. Rome ruled the world because belief in Rome became a self-fulfilling prophecy. The birth of new gods may be random—but the twilight of the old ones is inevitable.
 Source
 Add to Favorites
 Download image
 Share x
 Copy link
Davinci Jeremie urged people to buy $1 of Bitcoin in 2013 and became a symbol of early conviction. Years later, fame, lifestyle flexing, and token promotions sparked criticism. His journey reflects both crypto foresight and influencer-era controversy.
StarPlatinum/12 hours ago

A sweeping narrative ties Jane Street to India’s expiry-day options case, alleged 10AM Bitcoin sell patterns, Terra’s collapse, and ETF plumbing. While none prove misconduct, critics argue a common structure: move spot, monetize derivatives, keep execution opaque.
Bull Theory/5 days ago
A controversial narrative links Jane Street, ETF mechanics, and Bitcoin’s price behavior, pointing to lawsuit allegations, 10AM volatility patterns, and derivative hedging dynamics. The discussion raises broader questions about liquidity, structure, and price discovery.
Justin Bechler/6 days ago
A new federal lawsuit alleges Jane Street exploited non-public information tied to Terraform’s liquidity defenses, accelerating UST’s depeg and the Terra collapse. The firm denies the claims. The case may reignite debates on structure, design, and regulation.
Diana/7 days ago
Mean reversion and on-chain models sit at levels historically linked to bottom formation after capitulation. Realized losses reached record USD values, while deviations from anchor models remain extreme. Price pain may be fading; patience remains key.
Checkmate/7 days ago
Bitcoin didn’t fail as an asset — it matured into an ETF-driven trade. As institutional ownership rose, correlation with tech risk intensified. Short-term pressure reflects holder structure shifts, not thesis collapse.
Eric Jackson/2026.02.24
Hot feeds
A trader profits $448K by monitoring #Binance's new listings!
2024.12.13 17:37:29
A smart #AI coin trader made $17.6M on $GOAT, $ai16z, $Fartcoin,$arc.
2025.01.05 16:05:18
When Elon Musk tweeted about Moltbook, the meme coin MOLT experienced a short-term 30% price surge, hitting a new all-time high of $114 million.
2026.01.31 18:37:29
Last week, funds have flowed into #Bitcoin, #Ethereum, and #Hyperliquid.
2024.12.16 14:48:36
A $PEPE whale that had been dormant for 600 days transferred all 2.1T $PEPE($52M) to a new address.
2024.12.14 10:35:27
A sniper earned 2,277 $ETH ($8.3M) trading $SHIRO within 18 hours!
2024.12.03 23:09:08
MoreHot Articles
How did I turn $1,000 into $30,000 with smart money?
2024.12.09
10 promising AI Agent cryptos
2024.12.05
The 30-Year-Old Entrepreneur Behind Virtual, a Multi-Million Dollar AI Agent Society
2025.01.22
10 smart traders specializing in MEMEcoin trading on Solana
2024.12.09
A trader lost $73.9K trading memecoins in just 3 minutes — a lesson for us all!
2024.12.13
What is $SPORE? Let us take you through the on-chain records to show you how it works.
2024.12.25

