
 App Store
 Profile
 Security
 Sign Out
 Feeds
Feeds
 Articles
Gold’s 5-Sigma Crash: Inside the Largest Single-Day Drop Since 2013
We just witnessed history:
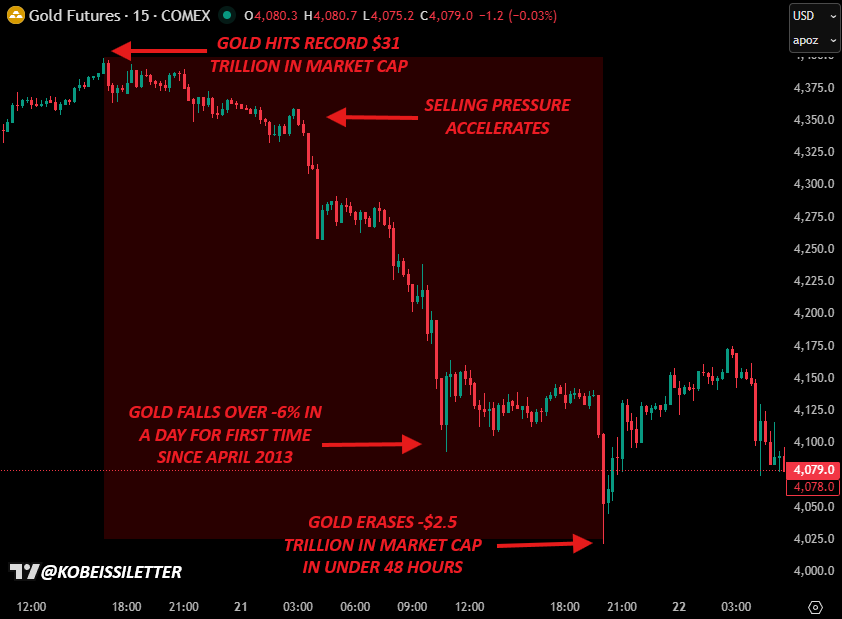
Yesterday, gold prices fell -5.7%, marking the largest 1-day drop since April 2013.
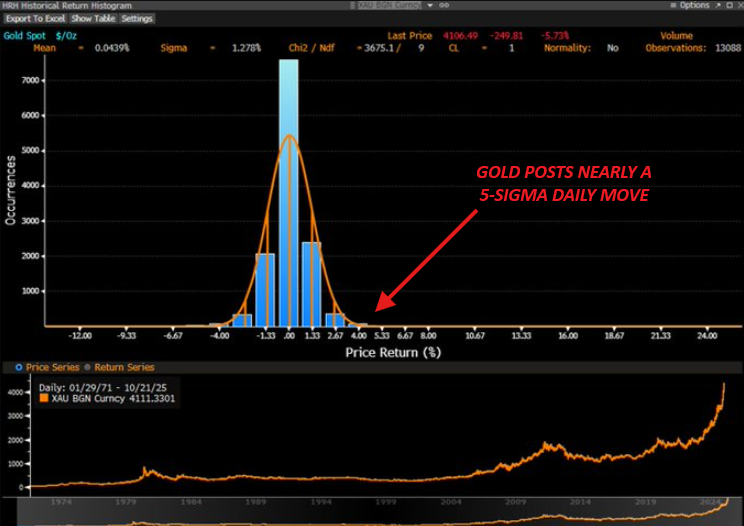
This is a ~4.5 sigma move.
In other words, such a large move only happens in 1 out of 240,000 days in a "normal" world.
What does it mean? Let us explain.
Statistically speaking, gold's move was a near 5-sigma event.
However, in reality, gold has seen a move of this magnitude only 34 times since 1971.
In other words, this occurs in 34 of 13,088 trading days or 0.26% of the time, per @BurggrabenH.
This is EXTREMELY rare.
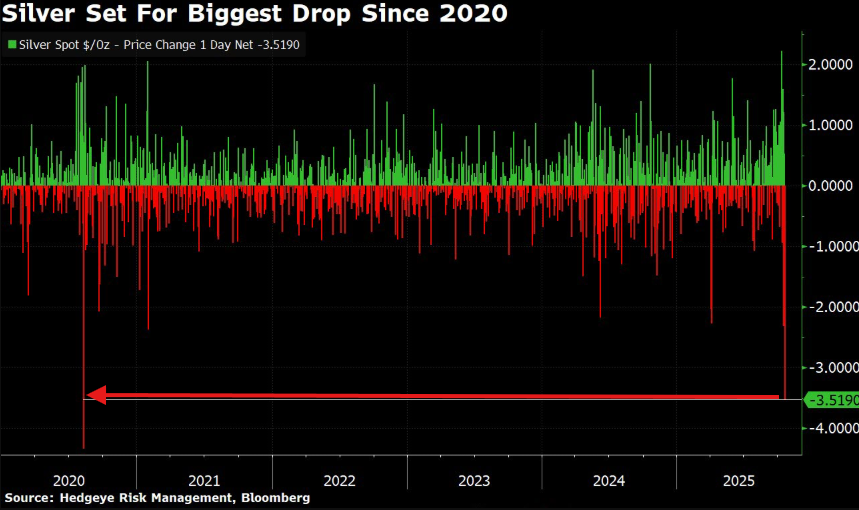
Silver prices were hit even harder.
Silver fell as much as -9% in a single-day and posted its largest daily decline since the 2020 crash.
Gold and silver neared -$3 trillion in lost market cap in just over 24 hours of trade.
But, we cannot ignore what happened BEFORE this.
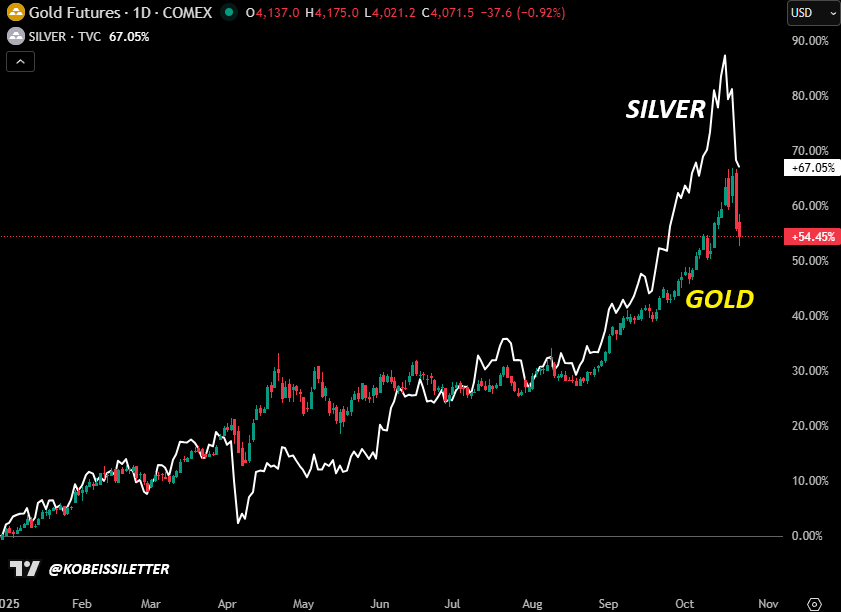
Before yesterday's crash, gold and silver posted their best rally in over 40 years.
Silver was up as much as +85% YTD and Gold was nearing +70% YTD returns.
Still, Silver and Gold are up +67% and +55% respectively, more than 4 TIMES the S&P 500's return.
A drop was overdue.
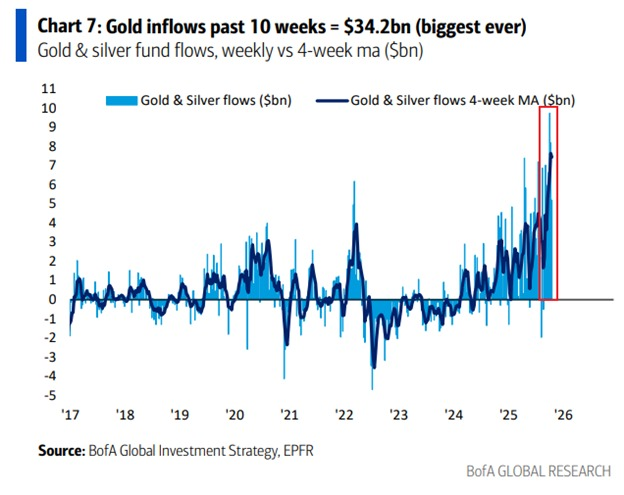
Flows were a CLEAR leading indicator that this drop was coming.
In the week ending October 10th, gold and silver funds posted +$8.2 billion in net inflows, the 2nd-largest inflow on record.
This followed a record +$9.5 billion seen in the prior week.
The trade was crowded.
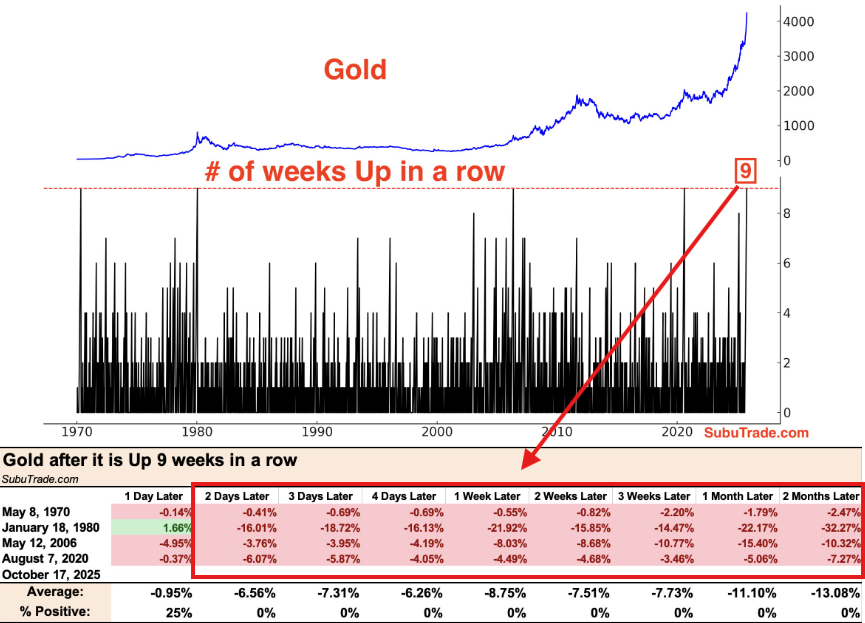
Meanwhile, gold was up for 9-STRAIGHT weeks for the 5th time in history.
Gold has never posted 10-straight weekly gains.
In the previous 4 times this happened, gold ended an average of -13% lower 2 months later.
So, what's next after the first blow to a historic run?
In our view, gold remains fundamentally strong.
In fact, it has only improved over the last few days.
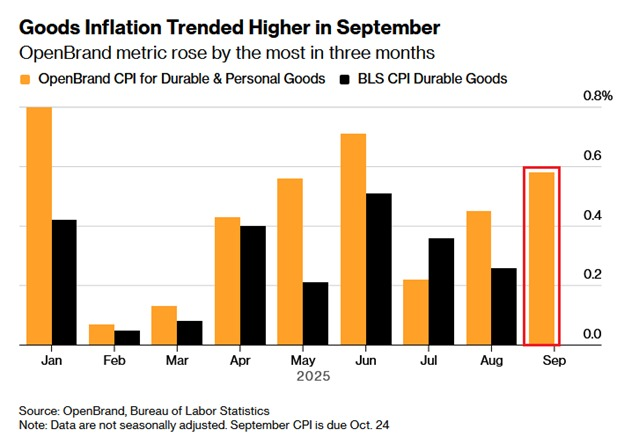
Amid the government data blackout, alternative metrics show US inflation at 2.6%.
This marks the 5th-consecutive monthly increase in these alternative metrics.
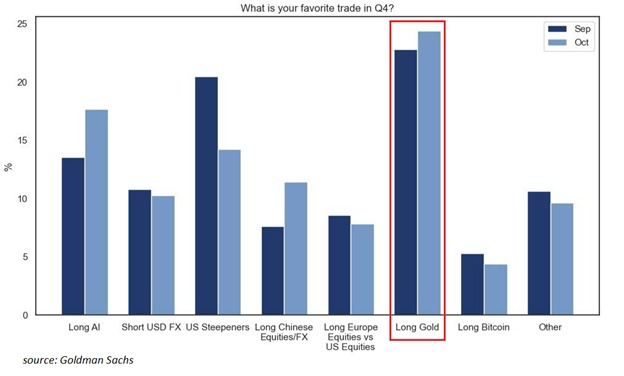
Meanwhile, institutional capital is still piling into the commodity.
~25% of investors surveyed by Goldman say their favorite trade is “long gold,” the highest reading for the 2nd consecutive month.
This is HIGHER than “long AI” stocks, which stands at ~18% of respondents.
On top of this, central banks are stocking up on gold while disregarding technicals.
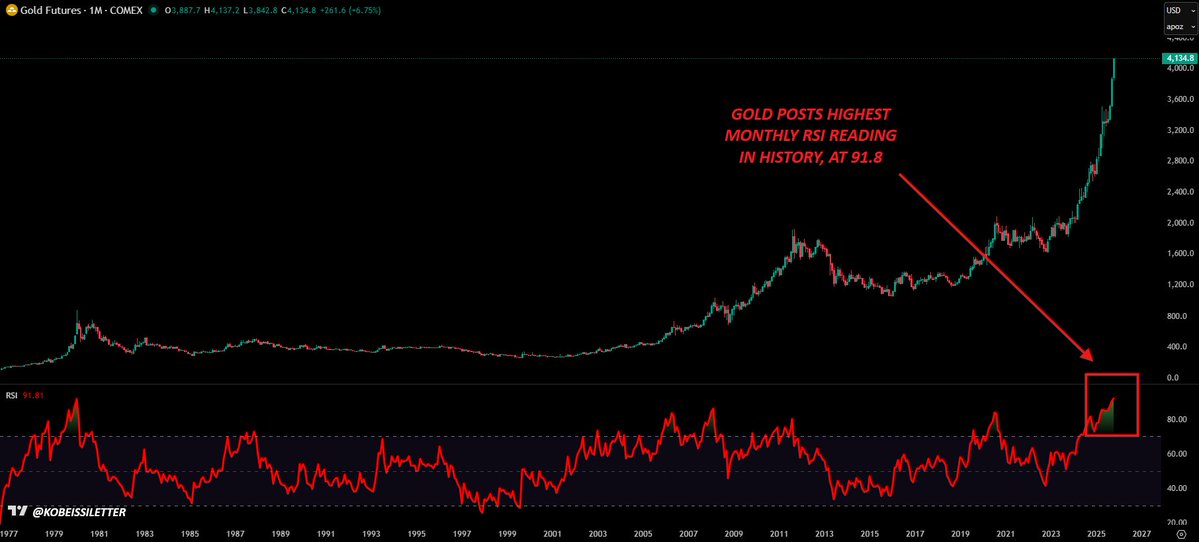
On October 13th, gold posted its highest monthly RSI reading in HISTORY, at 91.8.
Physical gold demand this year has proven that buyers are ignoring technicals.
We don't see this changing.
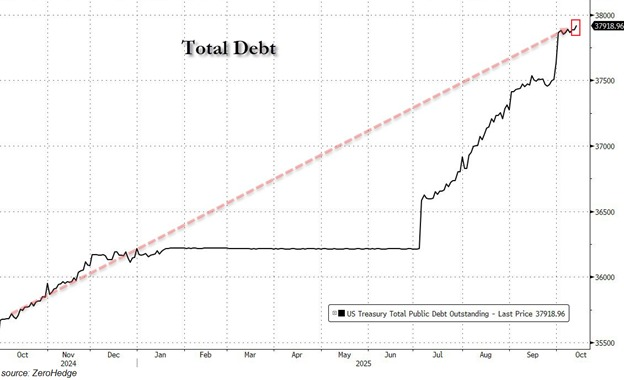
All of this is happening as the US simply keeps on printing money.
By as soon as Friday, total US debt is set to cross above $38 TRILLION for the first time in history.
This marks a +$400 BILLION jump this month, or +$25 billion per day.
Gold knows exactly what this means.
Gold's price drivers are having widespread implications on markets.
The macroeconomy is shifting and stocks, commodities, bonds, and crypto are investable.
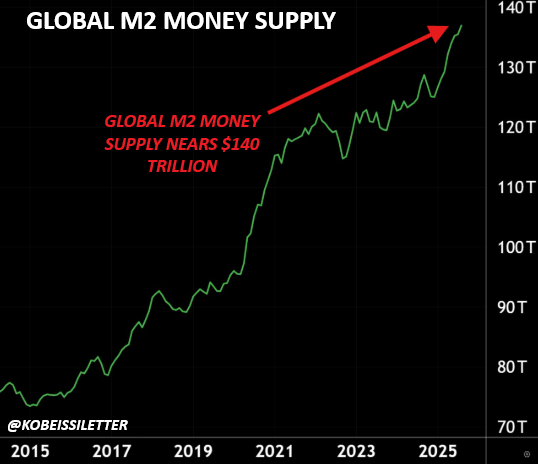
Lastly, global M2 money supply is about to hit $140 trillion for the first time in history.
In just 6 months, global M2 money supply has surged +$8 TRILLION.
Investors are losing confidence in fiat.
 Source
 Add to Favorites
 Download image
 Share x
 Copy link
A deep dive into how insiders allegedly manipulate crypto markets—triggering dumps, bull runs, and altseasons. From $700M Binance transfers to pre-Trump announcements, this thread exposes how big players control liquidity and profit from chaos.
Tracer/1 days ago

After last week’s perfect projection and the biggest liquidation cascade in years, $BTC faces another volatile week. With short liquidity clustered around $116K–$117K and the CME gap near $106.7K, traders watch for either a short squeeze or a final dip to $100K.
CrypNuevo/3 days ago
After losing over $30M in the largest crypto liquidation event ever, a top trader reflects on what went wrong, the lessons learned about leverage and risk, and why he’s staying optimistic. It’s not the end — just the start of his next chapter.
Unipcs (aka 'Bonk Guy')/2025.10.12
Crypto just experienced the largest liquidation event ever — over $19B in leveraged positions and 1.6M traders wiped out in a single day. Triggered by Trumps tariff shock, the cascade revealed extreme leverage but may set the stage for a strong rebound.
The Kobeissi Letter/2025.10.12
Trump’s sudden cancellation of his China meeting and threat of “massive tariffs” wiped $1.2T from U.S. markets in minutes. But analysts argue this is a bargaining move — not the start of a trade war. With AI investment and rate cuts ahead, dips may be buying opportunities.
The Kobeissi Letter/2025.10.11
Trump’s 100% China tariff announcement sparked a historic crypto crash — $1T wiped out, $20B+ liquidated, and whales profiting $200M. But history shows: every purge resets the market. Leverage flushed, panic peaked — the next leg may just be starting.
Bull Theory/2025.10.11
Hot feeds
A trader profits $448K by monitoring #Binance's new listings!
2024.12.13 17:37:29
A smart #AI coin trader made $17.6M on $GOAT, $ai16z, $Fartcoin,$arc.
2025.01.05 16:05:18
A $PEPE whale that had been dormant for 600 days transferred all 2.1T $PEPE($52M) to a new address.
2024.12.14 10:35:27
A sniper earned 2,277 $ETH ($8.3M) trading $SHIRO within 18 hours!
2024.12.03 23:09:08
Last week, funds have flowed into #Bitcoin, #Ethereum, and #Hyperliquid.
2024.12.16 14:48:36
A whale exchanged WIF and Bonk positions for Fartcoin!
2024.12.25 11:01:14
MoreHot Articles
How did I turn $1,000 into $30,000 with smart money?
2024.12.09
The 30-Year-Old Entrepreneur Behind Virtual, a Multi-Million Dollar AI Agent Society
2025.01.22
10 promising AI Agent cryptos
2024.12.05
10 smart traders specializing in MEMEcoin trading on Solana
2024.12.09
A trader lost $73.9K trading memecoins in just 3 minutes — a lesson for us all!
2024.12.13
What is $SPORE? Let us take you through the on-chain records to show you how it works.
2024.12.25

