
 App Store
 Profile
 Security
 Sign Out
 Feeds
Feeds
 Articles
Why Altcoins Pump (or Dump) on Just $500K: It’s Not Market Cap, It’s Liquidity
Most think altszn needs billions. Nah
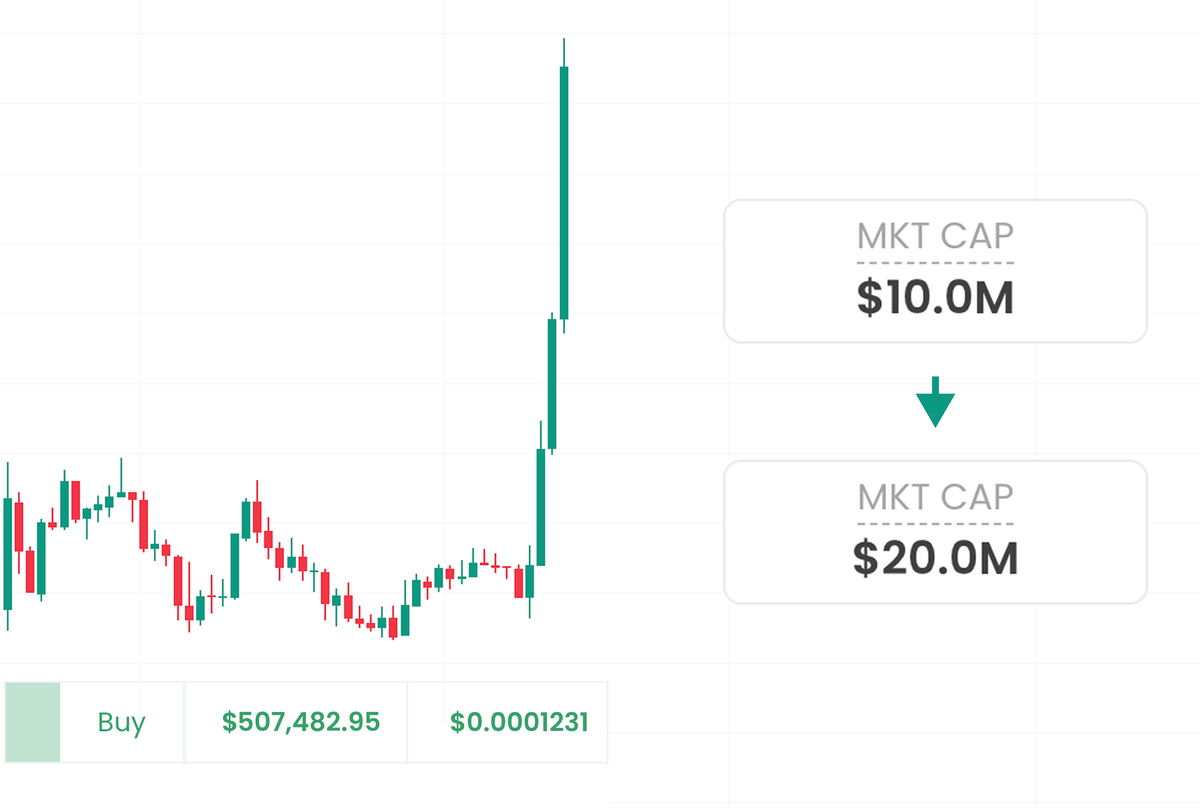
Imagine: $10M mc, price: $10
Think it takes $10M to hit $20?
Nope. Just $500k
To crash to $5? $200k
It’s not volume, it’s liquidity, and it changes everything
No one explains this. I'll
This 🧵 flip how u see alts 👇
➮ Doesn’t matter how long someone’s been in crypto – most still don’t get one thing:
✧ How liquidity really works
✧ And how much money it actually takes to pump or nuke a coin
If you are one of them?
It’ll cost you big (maybe it already has)
Let’s break it down 👇
2/➮ To understand how the growth of a particular coin, asset, or even stocks works, you need to look at the following:
- Market cap
- FDV
- Liquidity
- Vesting schedule
Now let's break each one down:
(1st part is more for beginners, for liquidity breakdown skip to tweet 6/)
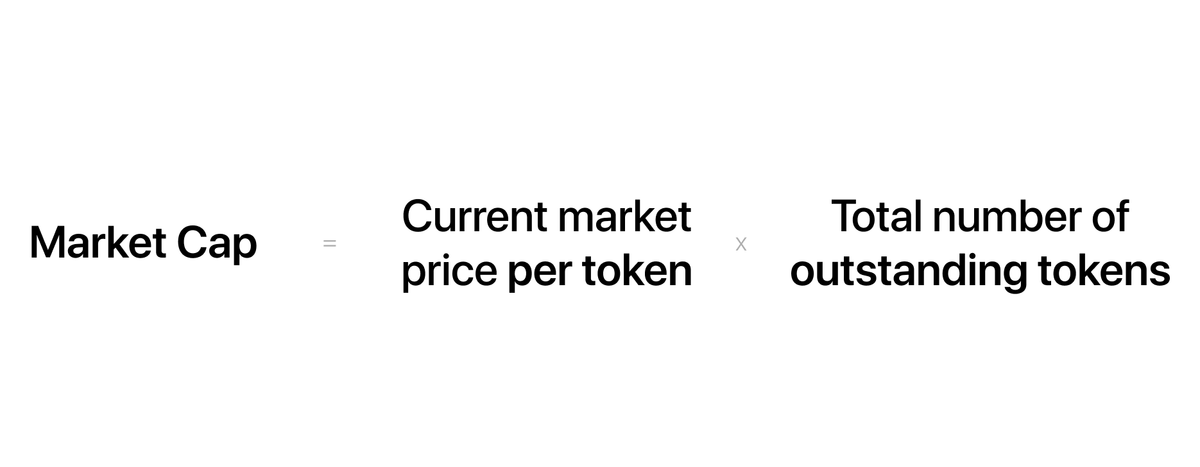
3/➮ The easiest: Market Cap
✧ Market cap is the total value of a cryptocurrency's circulating coins/tokens, reflecting the market's perception of an asset's worth
✧ With Simple Words:
Market Cap = Current Token Price × Circulating Supply
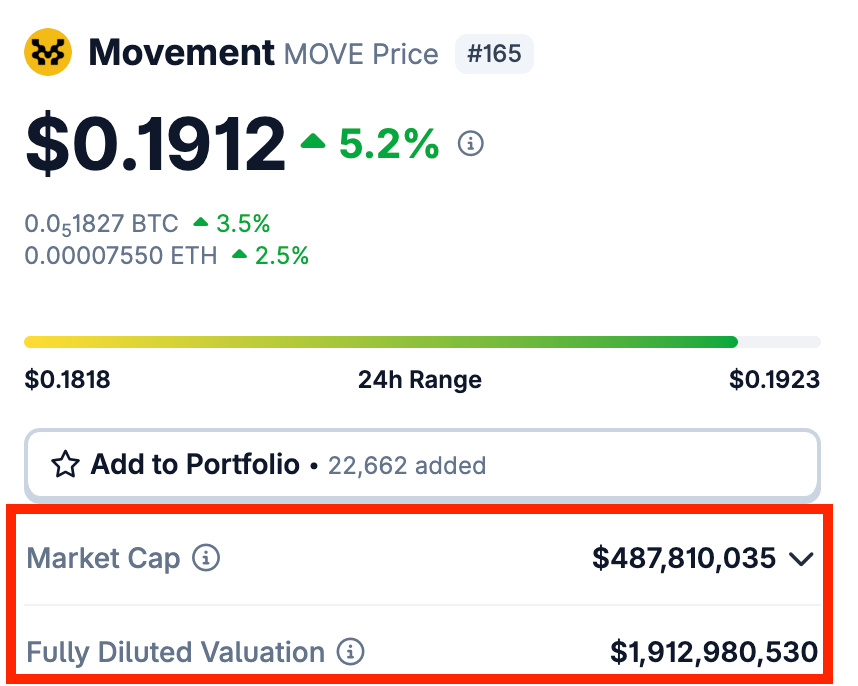
Many confuse market cap with FDV:
MC = circ. supply × price
FDV = total supply × price
This mistake gets newbies dumped on every unlock by VCs & early investors.
A 🧵 on how to avoid becoming exit liquidity in high FDV, low cap coins👇
https://x.com/nobrainflip/status/1731031522113900567
4/➮ What is price?
✧ It’s just what people pay right now - based on supply and demand
✧ But price alone means nothing
If a token has 1 trillion coins, even $0.000001 = $1M market cap.
To hit $1, it would need $1 * 1T = $1T market cap. That’s huge.
Forget about, look at mc
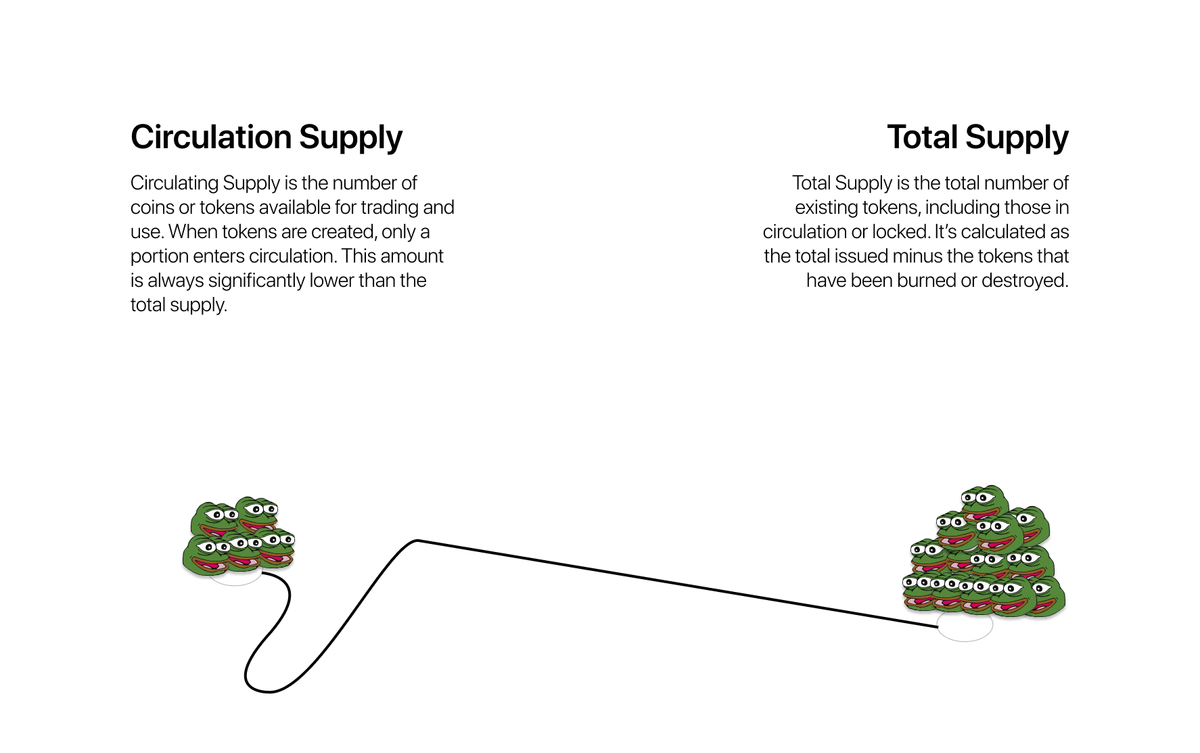
5/➮ What is Supply vs Circulating Supply?
✧ Supply = total coins that will ever exist
✧ Circulating Supply = what’s currently tradable
That’s why you must watch FDV & unlocks. Some tokens unlock 2× circ supply monthly.
MC might be $10M, but FDV is $200M - and new supply means incoming dumps.
Many miss this and get dumped on. Example: $APT launched with ~130M tokens in circulation, but total supply was 1B.
Every unlock added massive sell pressure.
Market cap looked “cheap” at $500M, but FDV was $4B+.
Always check unlock schedules - sometimes it seems you’re not early, but you’re exit liquidity.
6/➮ That was the easy part. Now the fun begins: LIQUIDITY
For some reason, most people still think like this:
✧ Coin X is $1, supply is 1B → $1B market cap
✧ To 2x the price, it needs $1B in buys
But that’s not how it works - at all 👇

7/➮ At first, it sounds like simple and logical math, but what gets overlooked is liquidity
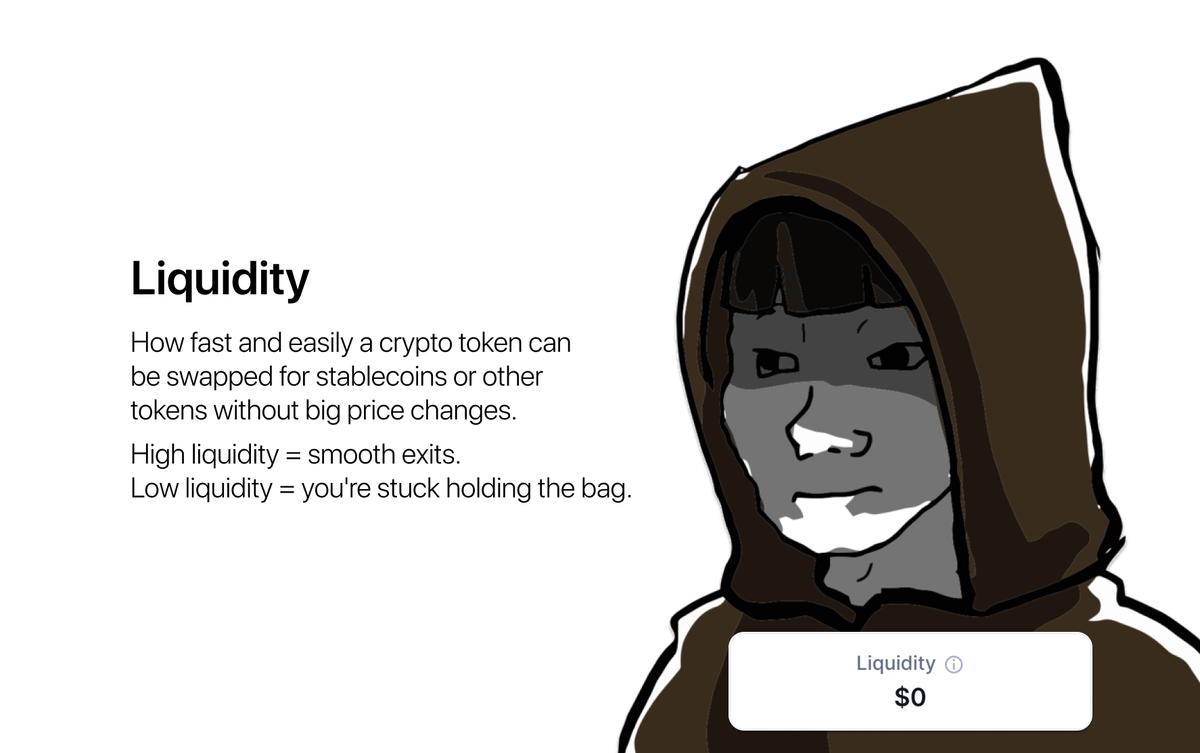
✧ Liquidity refers to the ability to quickly exchange a crypto at its current price without a significant loss in value
✧ Like a typical issue of large memecoins with 0 liquidity
8/➮ Liquidity is literally an essential part because:
✧ You can't sell more tokens than the available liquidity permits
✧ Which also means the following👇
✧ Imagine we have an X coin that is listed on only one, single DEX with only $30M available liquidity
9/➮ At the same time, the token price is $1 and market cap is $1B.
✧ But based on liquidity, it only takes ~$15M in buys to 2x coin X
✧ That kind of injection can double the price - no need to inject $1B
✧ Of course, that pump can be undone just as fast with $15M in sell pressure
But if holders don’t sell into the pump, the price can stay at 2x
Buy volume of $50M vs sell volume of $35M can double the price - it’s totally possible.
10/➮ But $1B mc with only $30M in real liquidity is already hard to grasp...
In Solana meme coins, the ratio is way more extreme.
A Solana meme with a $300M cap might only have $5M in liquidity.
From there? Do the math.
Buying or selling just 1% of supply can move price 2x in either direction.
That’s why memes fly.
But that doesn’t mean whales are actually cashing out at ATH.
Often, a big bagholder can’t exit near the top - every sell pushes price down hard.
That’s why consolidation phases are crucial - and why what goes up parabolically... usually comes down just as fast.
11/➮ A recent example: $JELLYJELLY had a $60M market cap - and dumped 50% from just $1.2M in sell pressure.
You can read more about it here - it’s a perfect case to help you truly understand how this works: https://x.com/degentradingLSD/status/1922712408042123399
12/➮ Exactly, this is how dozens of memecoin creators make daily profits through various schemes
✧ They list the memecoin on one or two DEXs with limited liquidity pools
✧ This way, they can strongly influence the price by creating different pump & dump schemes, etc
13/➮ So what does this all mean in practice?
Price movements aren’t driven by market cap logic - they’re driven by liquidity and flow. A token with low float and thin liquidity can 2x on hype with minimal buy pressure… but the same works in reverse.
What holds up over time? Projects with deep liquidity, gradual unlocks, strong communities, and real utility or demand.
Chasing low caps can bring fast gains - but without liquidity, you're always one sell away from a 50% nuke.
 Source
 Add to Favorites
 Download image
 Share x
 Copy link
Bitcoin may enter a prolonged sideways phase between $57K and $87K as markets enter a relief period following a 52% drop from ATH. This consolidation could mirror the 2022 fractal, creating liquidity before a potential breakdown toward the $44K–$50K range.
Doctor Profit/2026.03.09

Davinci Jeremie urged people to buy $1 of Bitcoin in 2013 and became a symbol of early conviction. Years later, fame, lifestyle flexing, and token promotions sparked criticism. His journey reflects both crypto foresight and influencer-era controversy.
StarPlatinum/2026.03.04
A sweeping narrative ties Jane Street to India’s expiry-day options case, alleged 10AM Bitcoin sell patterns, Terra’s collapse, and ETF plumbing. While none prove misconduct, critics argue a common structure: move spot, monetize derivatives, keep execution opaque.
Bull Theory/2026.02.27
A controversial narrative links Jane Street, ETF mechanics, and Bitcoin’s price behavior, pointing to lawsuit allegations, 10AM volatility patterns, and derivative hedging dynamics. The discussion raises broader questions about liquidity, structure, and price discovery.
Justin Bechler/2026.02.26
A new federal lawsuit alleges Jane Street exploited non-public information tied to Terraform’s liquidity defenses, accelerating UST’s depeg and the Terra collapse. The firm denies the claims. The case may reignite debates on structure, design, and regulation.
Diana/2026.02.25
Mean reversion and on-chain models sit at levels historically linked to bottom formation after capitulation. Realized losses reached record USD values, while deviations from anchor models remain extreme. Price pain may be fading; patience remains key.
Checkmate/2026.02.25
Hot feeds
A trader profits $448K by monitoring #Binance's new listings!
2024.12.13 17:37:29
A smart #AI coin trader made $17.6M on $GOAT, $ai16z, $Fartcoin,$arc.
2025.01.05 16:05:18
When Elon Musk tweeted about Moltbook, the meme coin MOLT experienced a short-term 30% price surge, hitting a new all-time high of $114 million.
2026.01.31 18:37:29
Last week, funds have flowed into #Bitcoin, #Ethereum, and #Hyperliquid.
2024.12.16 14:48:36
A $PEPE whale that had been dormant for 600 days transferred all 2.1T $PEPE($52M) to a new address.
2024.12.14 10:35:27
A sniper earned 2,277 $ETH ($8.3M) trading $SHIRO within 18 hours!
2024.12.03 23:09:08
MoreHot Articles
How did I turn $1,000 into $30,000 with smart money?
2024.12.09
10 promising AI Agent cryptos
2024.12.05
The 30-Year-Old Entrepreneur Behind Virtual, a Multi-Million Dollar AI Agent Society
2025.01.22
10 smart traders specializing in MEMEcoin trading on Solana
2024.12.09
A trader lost $73.9K trading memecoins in just 3 minutes — a lesson for us all!
2024.12.13
What is $SPORE? Let us take you through the on-chain records to show you how it works.
2024.12.25

