
 App Store
 Profile
 Security
 Sign Out
 Feeds
Feeds
 Articles
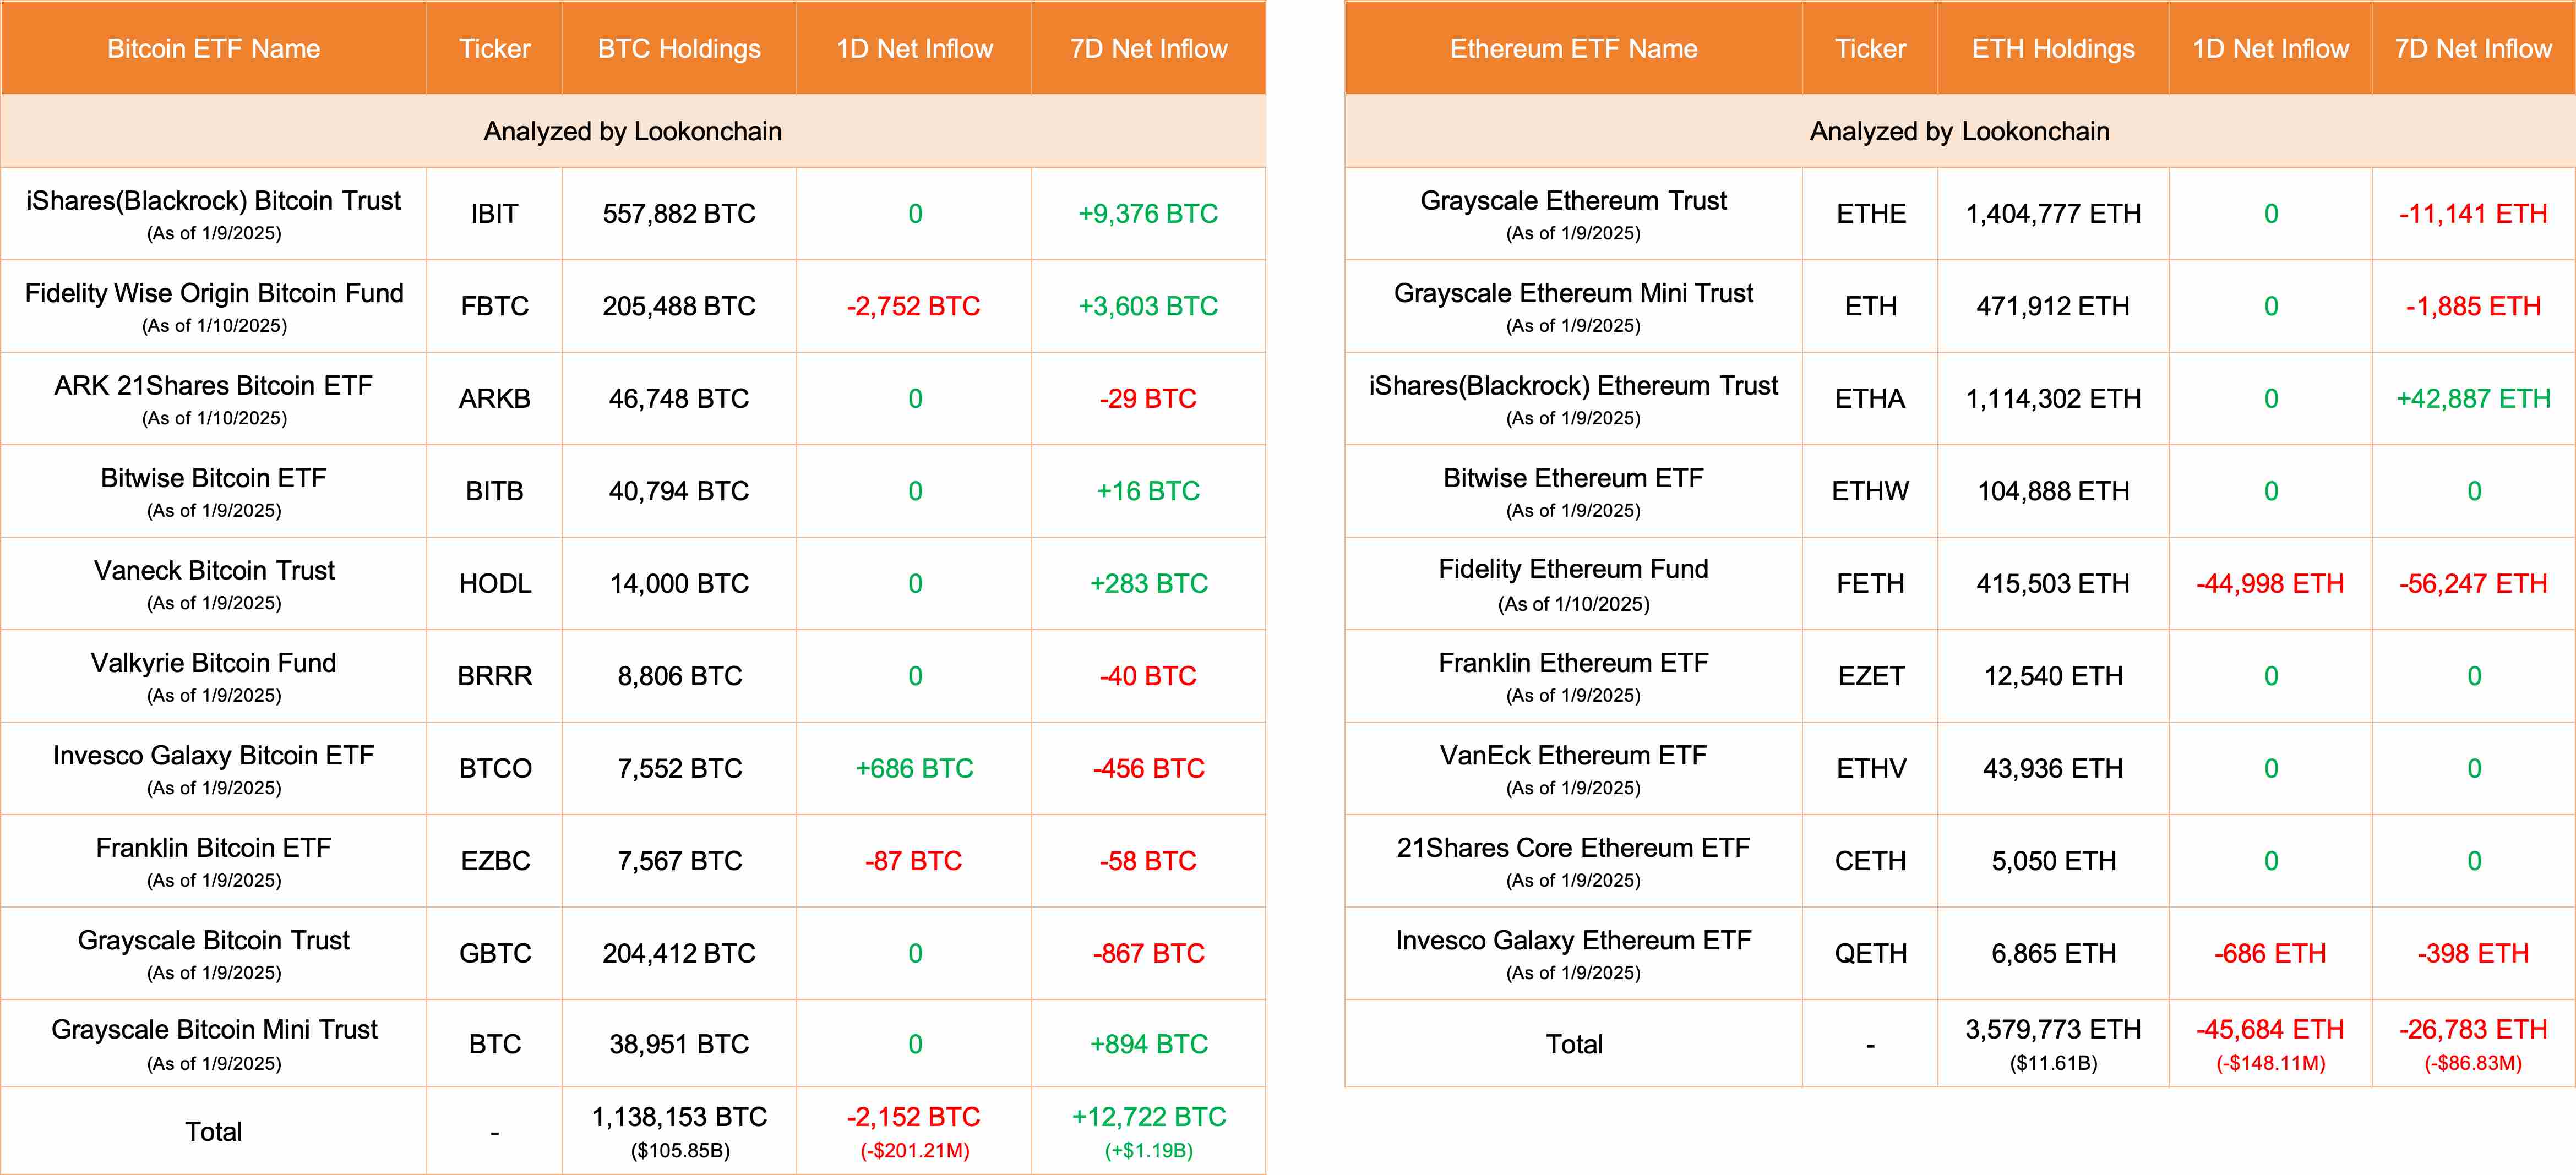
10 #Bitcoin ETFs outflows 2,152 $BTC(-$201.21M) and 9 #Ethereum ETFs outflows 45,684 $ETH(-$148.11M) yesterday.
2025.01.11 00:58:15
Jan 10 Update:
10 #Bitcoin ETFs
NetFlow: -2,152 $BTC(-$201.21M)🔴
#Fidelity outflows 2,752 $BTC($257.26M) and currently holds 205,488 $BTC($19.21B).
9 #Ethereum ETFs
NetFlow: -45,684 $ETH(-$148.11M)🔴
#Fidelity outflows 44,998 $ETH($145.88M) and currently holds 415,503 $ETH($1.35B).
https://x.com/lookonchain/status/1877370746105889201
 Source
 Add to Favorites
 Download image
 Share x
 Copy link
DEX Trading Surges 12.77%-20.15% WoW Despite $2.55B Stablecoin Outflow
11 minutes ago
U.S. manufacturing expansion hits four-year high, while bond market falls into "credit blind spot"
11 minutes ago
The White House plans to host a meeting with artificial intelligence companies on Tuesday to review AI frameworks.
11 minutes ago
South Korea’s move to raise margin requirements for leveraged ETFs is taking effect, as trading volume of single-stock leveraged products has fallen to one-tenth of their peak levels.
11 minutes ago
The three major U.S. stock indices extended their gains, with the S&P 500 index's rise widening to 1%.
11 minutes ago
Bitcoin ETFs post $210.32M outflows; Ethereum shows 7D inflows
11 minutes ago
Hot feeds
A trader profits $448K by monitoring #Binance's new listings!
2024.12.13 17:37:29
Last week, funds have flowed into #Bitcoin, #Ethereum, and #Hyperliquid.
2024.12.16 14:48:36
A $PEPE whale that had been dormant for 600 days transferred all 2.1T $PEPE($52M) to a new address.
2024.12.14 10:35:27
When Elon Musk tweeted about Moltbook, the meme coin MOLT experienced a short-term 30% price surge, hitting a new all-time high of $114 million.
2026.01.31 18:37:29
A smart #AI coin trader made $17.6M on $GOAT, $ai16z, $Fartcoin,$arc.
2025.01.05 16:05:18
A sniper earned 2,277 $ETH ($8.3M) trading $SHIRO within 18 hours!
2024.12.03 23:09:08
MoreHot Articles

How did I turn $1,000 into $30,000 with smart money?
2024.12.09
10 promising AI Agent cryptos
2024.12.05
The 30-Year-Old Entrepreneur Behind Virtual, a Multi-Million Dollar AI Agent Society
2025.01.22
10 smart traders specializing in MEMEcoin trading on Solana
2024.12.09
A trader lost $73.9K trading memecoins in just 3 minutes — a lesson for us all!
2024.12.13
What is $SPORE? Let us take you through the on-chain records to show you how it works.
2024.12.25

